
- Post-NFP US dollar strength in charge of GBP/USD.
- EUR/GBP outlook remains negative in the short-term.
For all market-moving economic data and events, see the DailyFX Calendar
The US dollar continues its climb higher and is within touching distance of making a fresh multi-month high. US Treasury yields remain elevated, supporting the greenback, as potential rate cuts are pushed back - and priced in - for May next year. The US dollar index has also gained on renewed weakness in the Euro as the single block’s economy struggles to gain any traction.
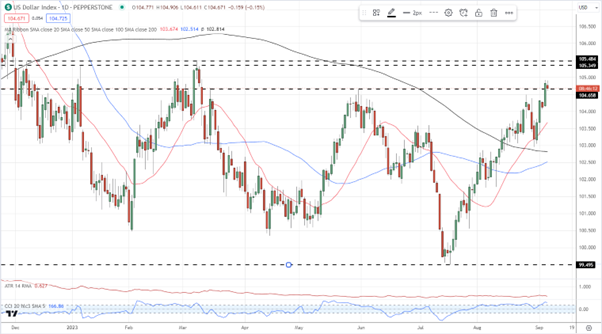
The daily US dollar chart is now pushing towards a pair of prior horizontal highs at 105.35 and 105.48 and these may be difficult to break convincingly. The CCI indicator also shows the US dollar in overbought territory and this is likely to temper any further short-term gains.

US Dollar Index Daily Price Chart September 6, 2023
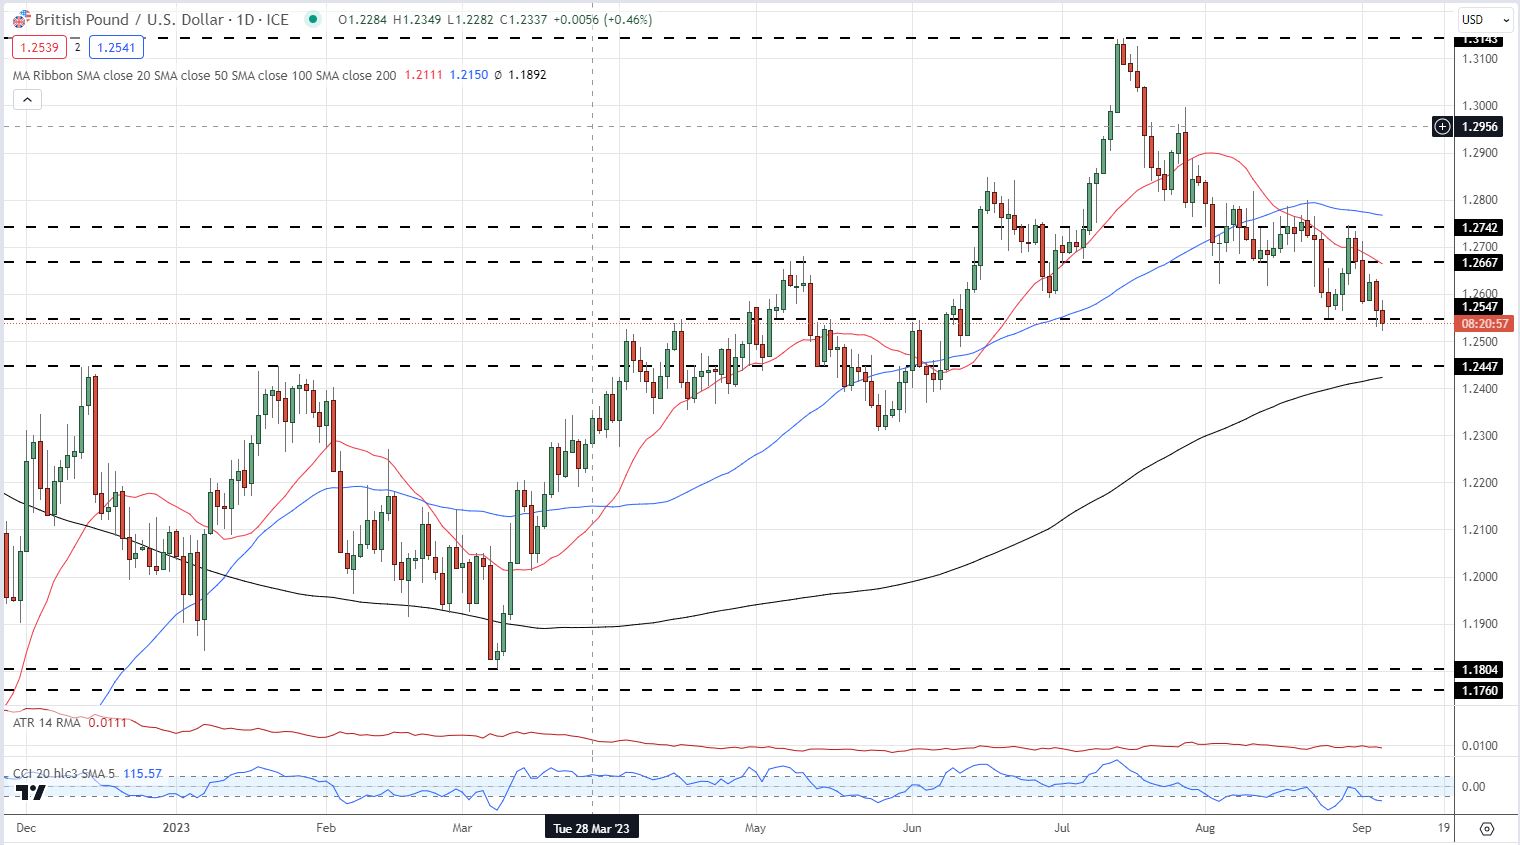
GBP/USD is trading on either side of an old level of horizontal support at 1.2547 with little domestic data this week to force the next move. There is also little of note on the US calendar this week apart from today’s ISM services release, and if this comes inline with market expectations, GBP/USD may continue to move either side of 1.2547 going into the weekend. A break and open below would leave 1.2447 exposed, while a move higher brings 1.2667 into play.
GBP/USD Daily Price Chart September 6, 2023
See How GBP/USD Traders are Positioned
| Change in | Longs | Shorts | OI |
| Daily | -9% | 6% | 0% |
| Weekly | -31% | 36% | -2% |
EUR/GBP remains trapped in a range but continues to print fresh lower highs. All three simple moving averages now act as resistance, although both the 20- and 50-day smas are within touching distance. Support is seen around the 0.8500 area while initial resistance is off the short-term double top around 0.8610 mad eon August 29th and 30th. Above here, 0.8670 comes into view.
EUR/GBP Daily Price Chart – September 6, 2023

What is your view on the British Pound – bullish or bearish?? You can let us know via the form at the end of this piece or you can contact the author via Twitter @nickcawley1.