


Euro, EUR/USD, US Dollar, EUR/JPY, Japanese Yen - Talking points
- EUR/USD has made a 20-year low on USD strengthening
- EUR/JPY remains at lofty levels but the trend is being questioned
- Momentum might be the key. How low can EUR/USD go?
Introduction to Technical Analysis
Moving Averages
Recommended by Daniel McCarthy
EUR/USD TECHNICAL ANALYSIS
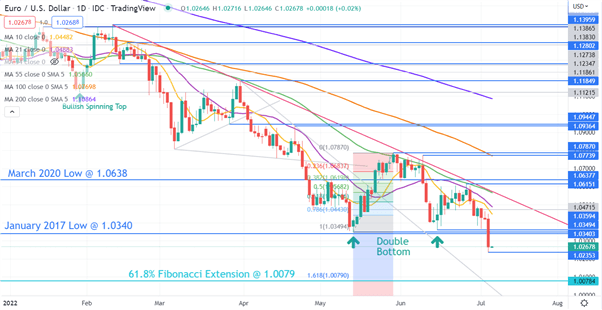
EUR/USD snapped downward as it traded at its lowest level since December 2002.
A previous Double Bottom was ignored in the move as bearish momentum appears to have accelerated.
All short, medium and long term Simple Moving Averages (SMA) are displaying negative gradients and are in sequential order of shortest to longest tenor from the price. This indicator became apparent on 29th June.
After breaking below three prior lows in the 1.0340 – 1.0360 area, this may now become a resistance zone. Further up, there is potential resitance at the 10-, 21- and 55-day SMAs. The latter coincides with a descending trendline, currently dissecting at 1.0566.
Support may lie at the recent low of 1.0235 or the 1.618% Fibonacci Extension at 1.0079.
Introduction to Technical Analysis
Learn Technical Analysis
Recommended by Daniel McCarthy
EUR/USD VOLATILITY
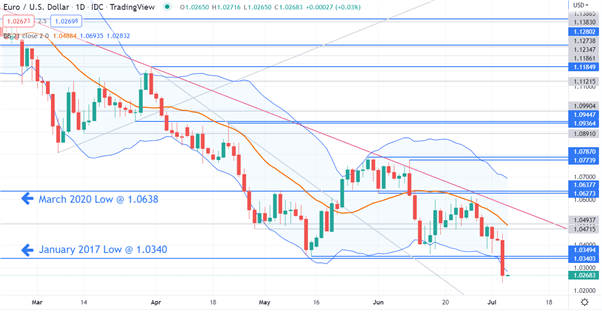
Not surprisingly, the price has broken below the lower band of the 21-day simple moving average (SMA) based Bollinger Band. A close back inside the band might be an indication of a pause in bearishness.
The width of the bands have expanded slightlyon increasing historical volatility that the Bollinger Bands measure.
Market priced forward looking volatility has picked up markedly. The benchmark 1-month at the month (ATM) volatility price is at its highest level since the Russian invasion of Ukraine, trading at 10.93%.
It spent all of 2021 in a 4.5 – 7.5% range. This might suggest further uncertainty in EUR/USD lies ahead.
EUR/JPY TECHNICAL ANALYSIS
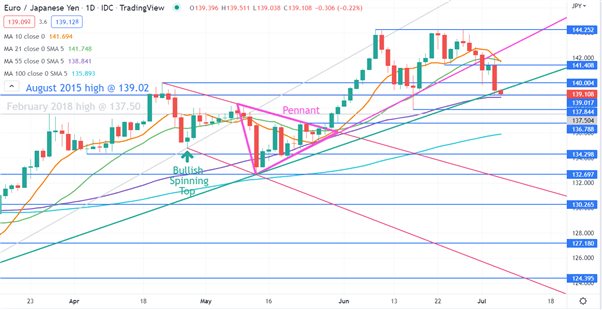
EUR/JPY failed to break above the 7-year high of 144.25 resistance on several occasions, before falling down through an ascending trendline.
It is currently threatening to break below a second ascending trendline, but the descent has paused at the 55-day simple moving average (SMA), currently at 138.84. There is also an historical break point nearby at 139.02
A clean break below these three potential support levels could suggest further bearishness may unfold. The 10-day SMA looks likely to cross below the 21-day SMA and this would form a Golden Cross, that may indicate that bearish momentum is evolving.
Support may lie at the previous low of 137.84 or at the break point of 134.30.
On the topside, resistance might be offered at 141.41 or the high of 144.25.
--- Written by Daniel McCarthy, Strategist for DailyFX.com
To contact Daniel, use the comments section below or @DanMcCathyFX on Twitter


