


Indices Technical Forecast: Neutral to Bullish
- S&P 500 trying to hold onto channel support
- Dow Jones is the laggard, go-to short if things deteriorate
- Nasdaq 100 has support just below, anticipated to remain the leader
S&P 500 Technical Forecast
The S&P 500 has been in a corrective phase, but that could end soon as channel support dating to May continues to hold up. Or not. A break higher may soon ensue that leads to a new high above 4545. In the event we do see a new high, the top-side of the channel around 4600 would come into focus.
On the flip-side, if the channel fails to hold and 4435 breaks, then the market could be in for a bit of trouble as the usual dip-and-rip sequence fails. It might not mean the market tanks, but would certainly be a worthy warning for longs and a reason for shorts to sit up.
All-in-all, continuing to respect support and the trend for as long as it lasts – next week may be a telling one on that front.
S&P 500 Daily Chart

Dow Jones Technical Forecast
The Dow Jones made a slight lower-low from August, and while this isn’t overly bearish given the general tone of the market, it could mean that if the S&P fails to hold that the Dow will lead to the downside. This index would be the go-to short in the event we see risk-off.
Dow Jones Daily Chart

Dow Jones Chart by Tradingview
Nasdaq 100 Technical Forecast
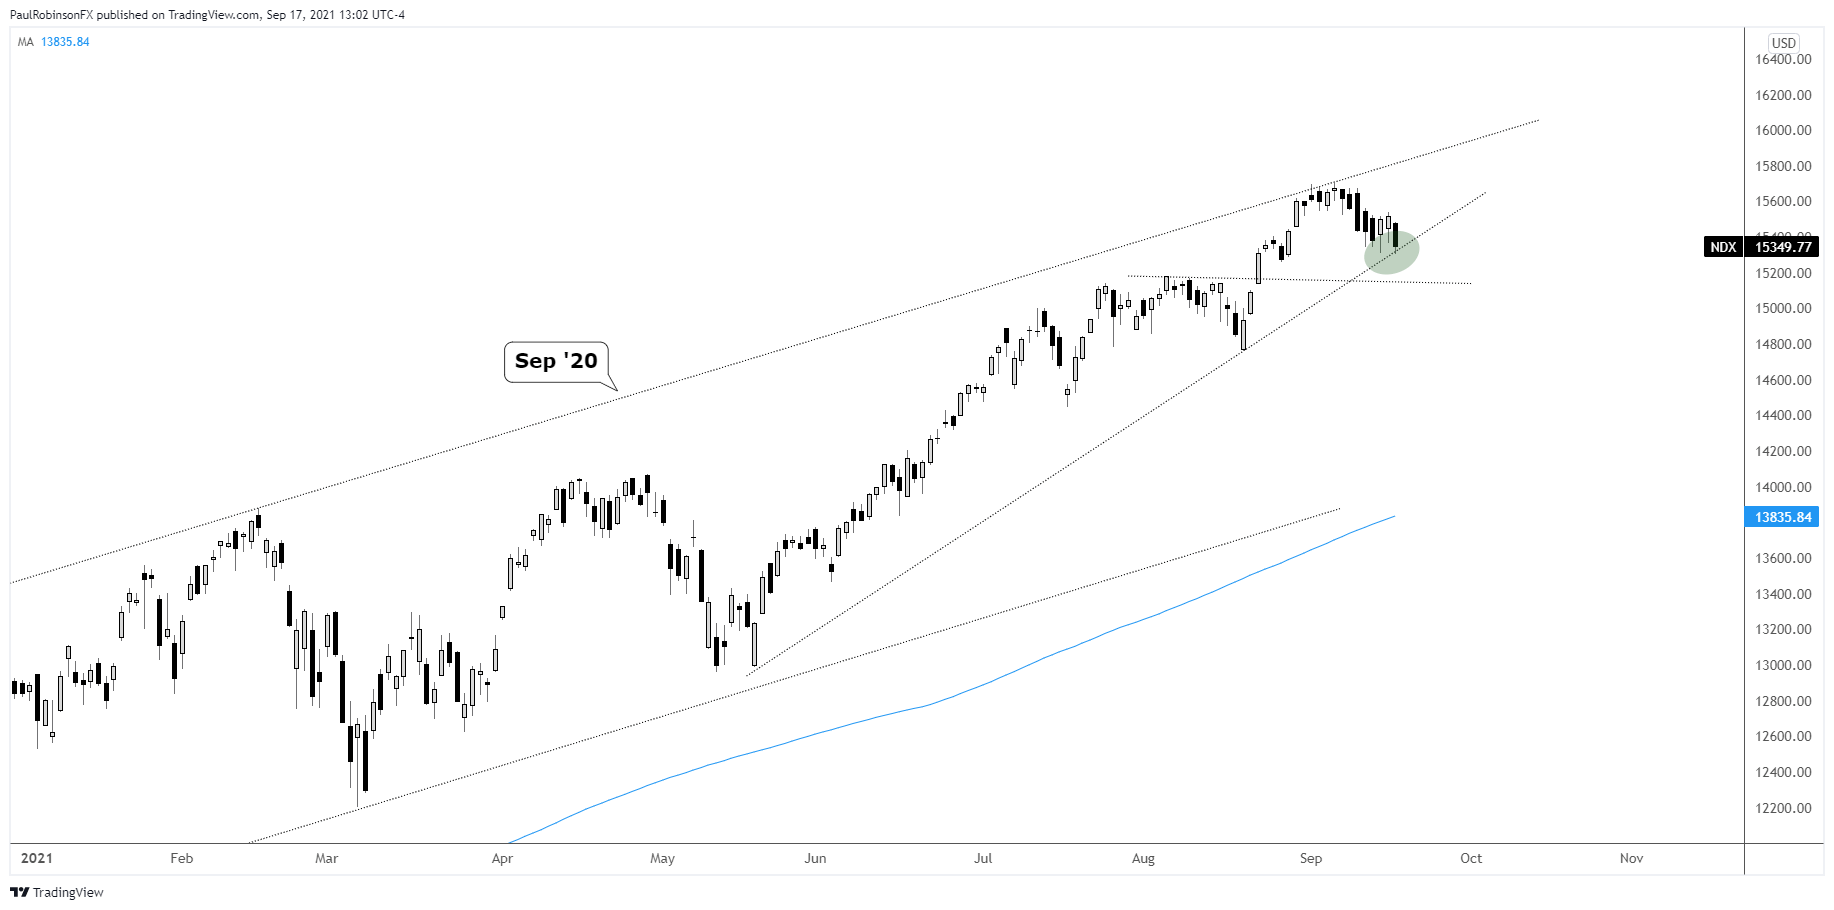
The Nasdaq 100 remains the leader and it will be considered such until we see a clear rotation out of growth into value. There is a trend-line rising up from May to keep an eye on. It’s not as sturdy as the trend-line in the SPX, but still worthy of attention.
Renewed strength will have the record high at 15701 in focus, quickly followed by the September 2020 slope that recently helped keep a lid on the rally. If selling shows, instead, then the May trend-line and the August high at 15184 will come into focus as important support. Hold these levels and the outlook remains neutral at worst, but break and the bias could quickly turn south.
Nasdaq 100 Daily Chart
Nasdaq 100 Chart by Tradingview
Resources for Forex Traders
Whether you are a new or experienced trader, we have several resources available to help you; indicator for tracking trader sentiment, quarterly trading forecasts, analytical and educational webinars held daily, trading guides to help you improve trading performance, and one specifically for those who are new to forex.
---Written by Paul Robinson, Market Analyst
You can follow Paul on Twitter at @PaulRobinsonFX


