Oil Key Talking Points:
- Oil nears $75 per barrel attempting to break above ascending channel pattern
- Momentum indicators support further upside


Last time I was sat here writing a quarterly forecast for oil we were faced with a third wave of Covid-19 with new infections spiralling out of control around the world, which made the outlook for oil demand very weak. The technical picture was also showing signs of weakness following a cyclical pattern from previous years, so I was expecting prices to retreat further before recovering.
That hasn’t been the case. Despite going through one of the deadliest waves of Covid we’ve had in the last year, oil prices started rebounding sooner than expected, and were trading above $65 a barrel by April, and have been rising steadily since then.
Looking ahead to Q3, there is no denying that the fundamental picture is pretty bullish. With economies reopening and investors hedging against inflation there only seems to be one way for oil prices at the moment, and that is upwards.
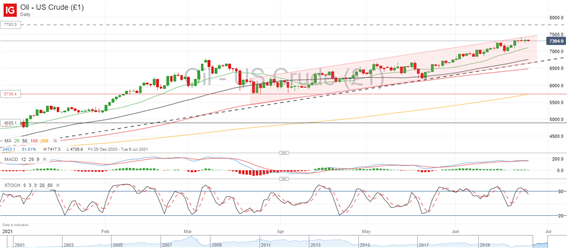
And from a technical standpoint there seems to be no way of denying that, at least if looking at the short-term chart. Ever since the end of March, crude prices have been showing a consistent trend of higher lows and highs, creating a strong ascending channel pattern.
The daily chart is showing positive momentum on the key moving averages as well as the MACD in positive territory. The stochastic oscillator is dipping slightly from overbought conditions which allows for further bullish momentum to consolidate in the short-term. There is plenty of room for WTI crude to pullback within its range without risking the trendline support so the outlook remains pretty bullish.
Crude WTI Daily Chart (December 2020 – June 2021)

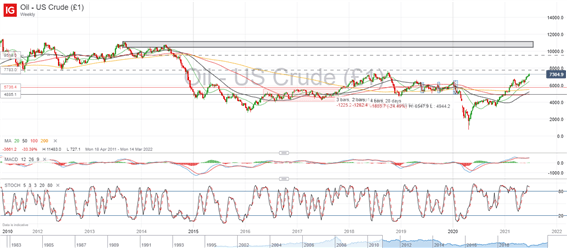
Looking at the weekly chart, the last time WTI crude was at current levels (73.50) was back in October 2018. The top back then was $76.82 but I would expect prices in Q3 to top this level. We have to go further back to June 2014 to see price action above $100 per barrel, which seems to be the price targets most analysts are expecting at this point.
WTI Crude Weekly Chart (May 2011 – June 2021)

There are some important areas to look out for before we get there, with the $77.80 area being one of them given how there has been conflicting price pressures since 2011, and it is also in close proximity with the 2018 top. There is also the $95 area where price confluence has been significant in the past, so this may be an area of consolidation before a greater move to $100 is achieved.
“To read the full Oil forecast including the fundamental outlook, download our new 3Q trading guide from the DailyFX Free Trading Guides!


--- Written by Daniela Sabin Hathorn, Market Analyst
Follow Daniela on Twitter @HathornSabin


