


Brent Crude Oil Price, Chart, and Analysis
- Brent crude rallies on increased global demand.
- Natural gas prices hits a multi-year record high.
Trade Smarter - Sign up for the DailyFX Newsletter
Receive timely and compelling market commentary from the DailyFX team
Keep up to date with all market-moving data releases and events by using the DailyFX Calendar
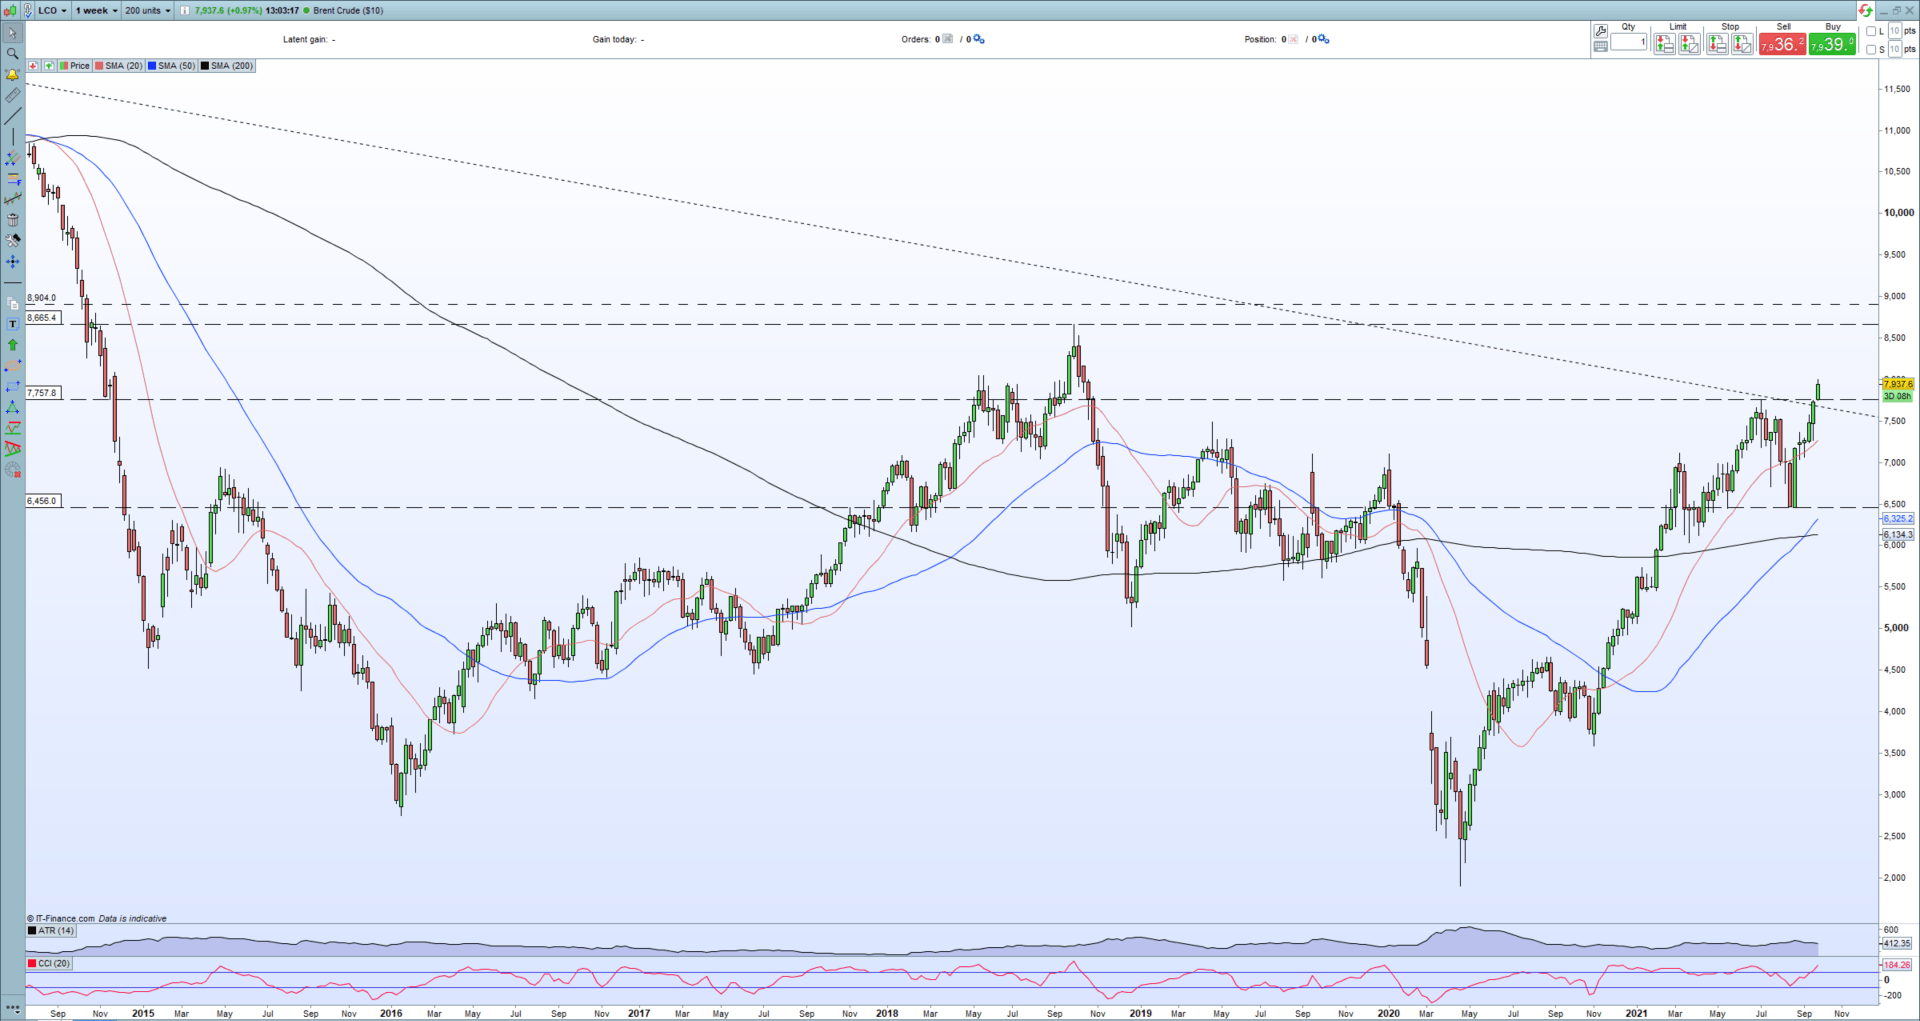
The price of Brent crude oil continues to soar, touching highs last seen three years ago as demand outstrips supply. The continued rollback of covid-19 restrictions in economies around the globe is driving demand ever higher with supply struggling to keep up. OPEC+ will meet next – October 4 – and they may need to increase production further to help alleviate the market shortage. Brent crude touched $80/bbl. earlier and may now set its sights on the October 2018 high at $86.65/bbl. if the OPEC+ leaves production at its levels. The Organization of the Petroleum Exporting Countries will also release its World Oil Outlook next week and this now takes on increased significance as prices rally hard.
Brent Crude Oil Weekly Price Chart September 28, 2021
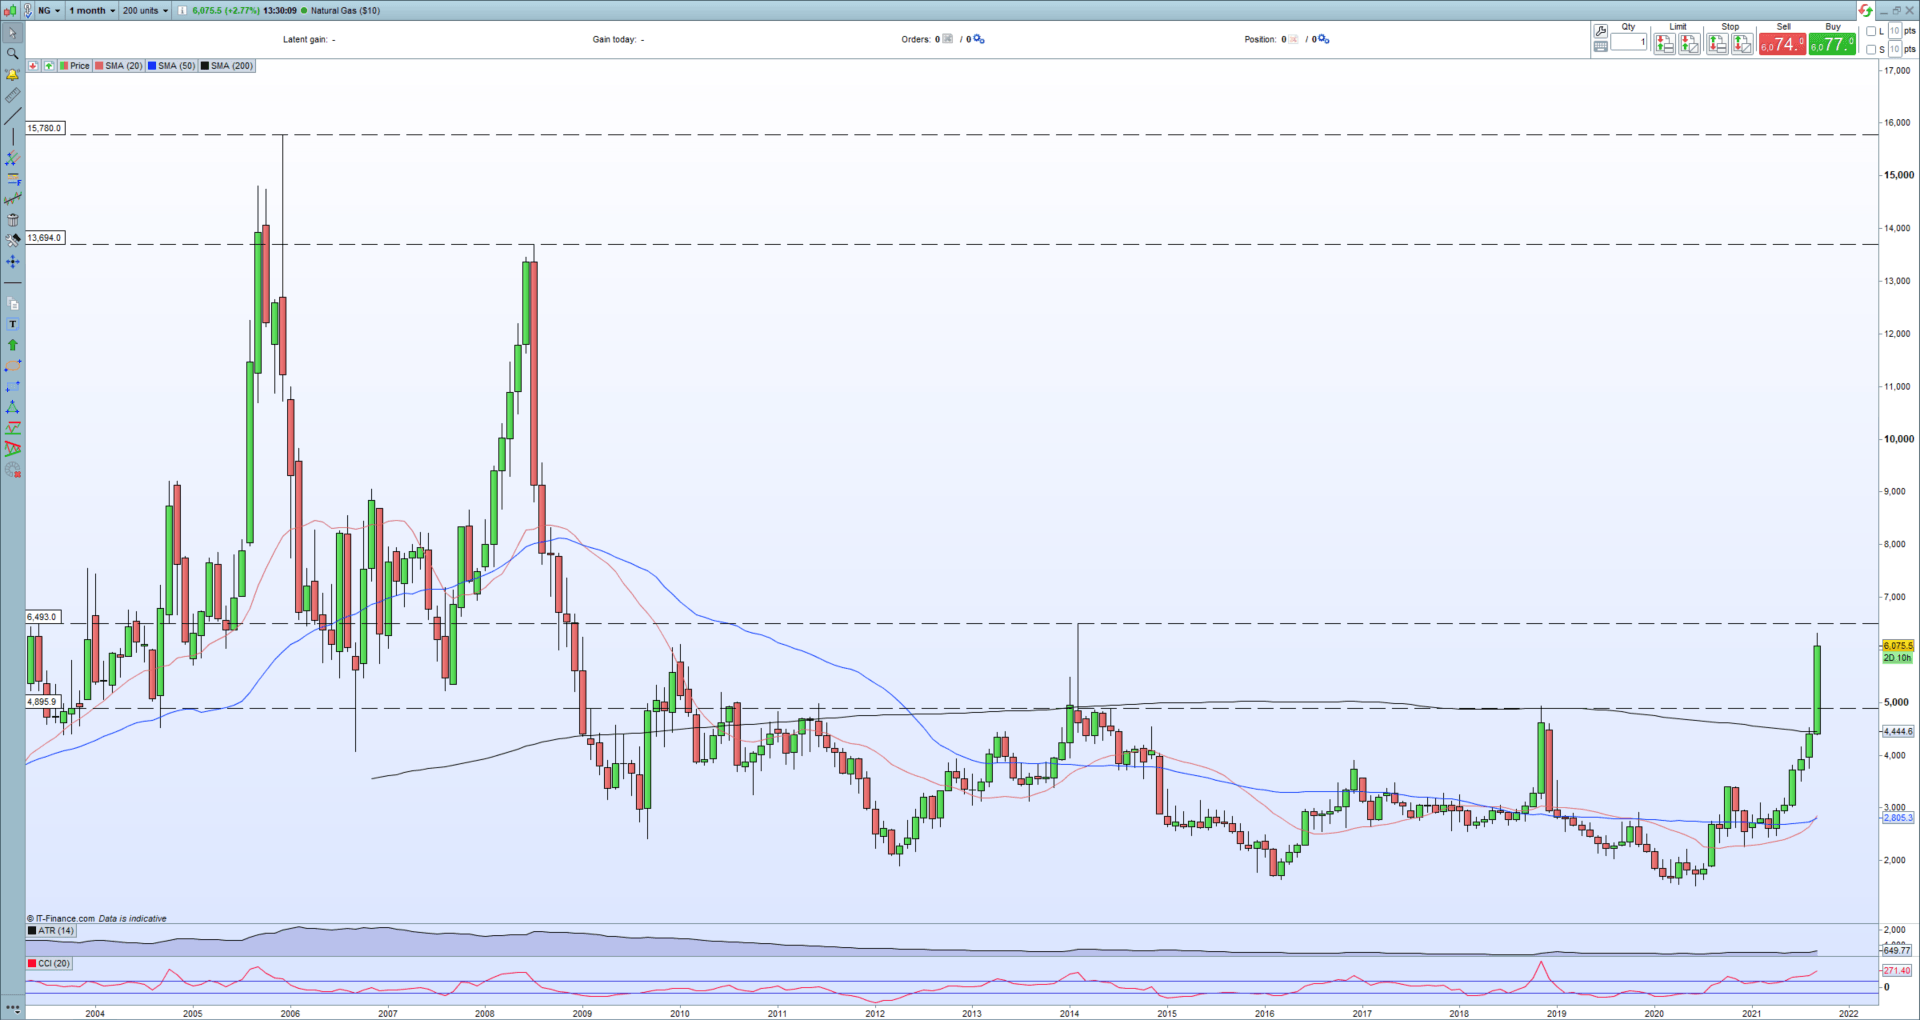
Natural gas prices are also heading ever higher as supply remains unable to meet demand in Europe as inventory levels crumble. The severe shortage of natural gas in Europe is in part due to heavy demand from Asia and a cut back in supply from Russia and markets are now anticipating further demand as the winter months near. The monthly natural gas chart shows the recent sharp rally with the February 2014 high at $64.93 the next level of resistance. The move higher is given further credibility by the confirmed break above the long-term simple moving average.
Natural Gas Monthly Price Chart September 28, 2021
What is your view on Oil and Gas – bullish or bearish?? You can let us know via the form at the end of this piece or you can contact the author via Twitter @nickcawley1.


