
Euro (EUR/USD)Price, Chart, and Analysis
- Fibonacci resistance in play, moving averages turn lower.
- US data prints will decide the short-term outlook.

For all market-moving economic data and events, see the DailyFX Calendar.
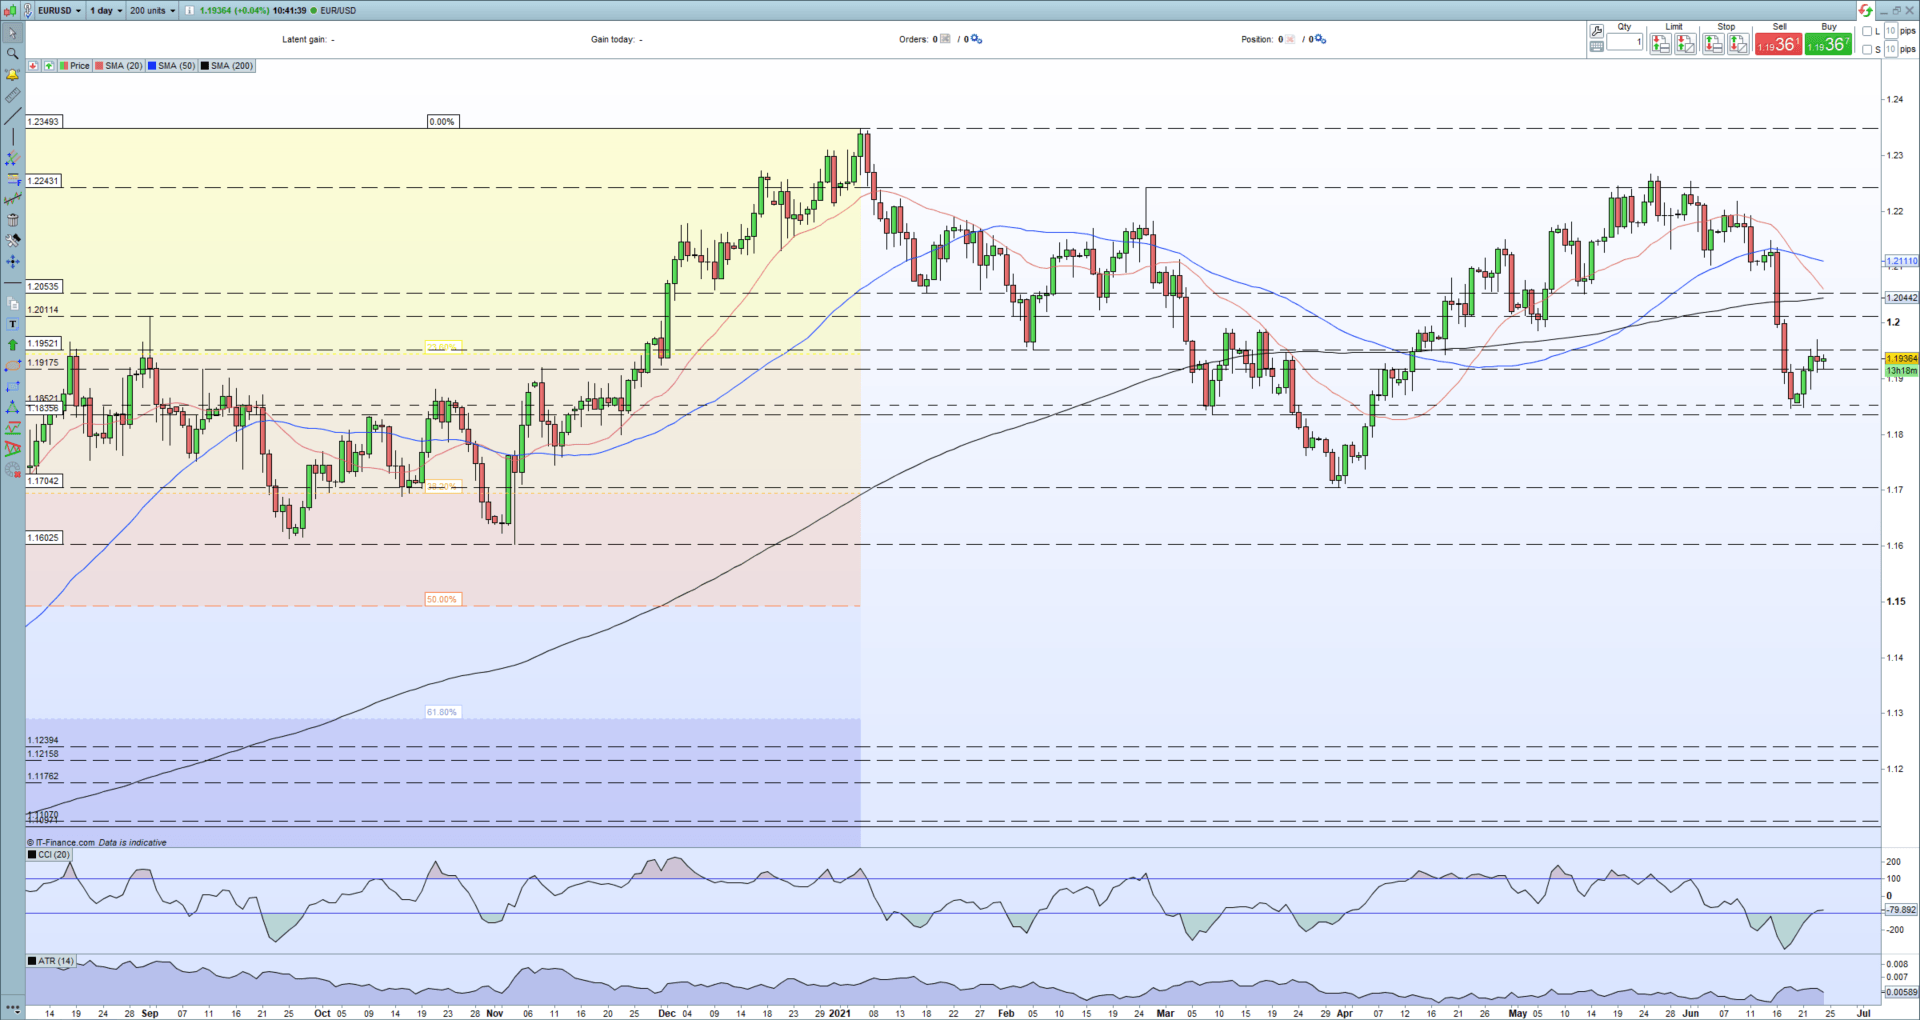
EUR/USD is currently pressing against a short-term resistance level around 1.1940/50 as it attempts to pare back recent losses. The sell-off from the May 25 high accelerated sharply last week after the US dollar grabbed a strong bid post-FOMC. This resistance level, off the 23.6% Fibonacci retracement of the March 2020/January rally, is being helped by both the 20- and 50-day sma turning lower, while the longer-dated sma is currently situated at 1.2044. A break back to, and above, the 200-dsma is looking increasingly unlikely in the short-term.
Moving Averages Explained for Traders
Later today, US durable goods data are released in the US, at the same time as the final Q1 US GDP print, before attention turns to Friday’s US PCE release, the Fed’s favored inflation reading. Tomorrow’s core PCE price index y/y for May is expected to show inflation rising to 3.4%, from 3.1% in April, substantially higher than the central bank’s target of around 2%. This release is expected to set the short-term course for the US dollar and a range of US dollar pairs.
EUR/USD Daily Price Chart (August 2020 – June 24, 2021)
| Change in | Longs | Shorts | OI |
| Daily | 19% | -6% | 2% |
| Weekly | -14% | 10% | 0% |
Retail trader data show 56.30% of traders are net-long with the ratio of traders long to short at 1.29 to 1. The number of traders net-long is 3.41% higher than yesterday and 3.28% higher from last week, while the number of traders net-short is 7.13% higher than yesterday and 0.58% higher from last week.
We typically take a contrarian view to crowd sentiment, and the fact traders are net-long suggests EUR/USD prices may continue to fall.Positioning is less net-long than yesterday but more net-long from last week. The combination of current sentiment and recent changes gives us a further mixed EUR/USD trading bias
What is your view on EUR/USD – bullish or bearish?? You can let us know via the form at the end of this piece or you can contact the author via Twitter @nickcawley1.