


CRUDE OIL PRICE OUTLOOK:
- New coronavirus strain found in the UK weighed on the energy demand outlook
- A softening demand in the physical oil market signals further pullback in prices
- WTI crude oil prices pared intraday losses as USD retreated, US passed stimulus package
Crude oil prices erased deep intraday losses and rose back to Friday’s closing mark as the US Dollar retreated. Yet, oil prices have likely retraced from their 10-month highs amid headwinds of a new type of coronavirus strain found in the UK, which is reportedly 70 percent more transmissible than the original. Sentiment took a hit as the potential for wider spread may threaten further lockdown measures and travel bans between the UK and the Europe in a time when both sides are trying to finalize a post-Brexit trade agreement. A worsening virus situation and Brexit uncertainties may point to an extension of travel restrictions and trade complications between the two major economies, souring sentiment for oil trading.
A slowdown of purchases in the physical oil market may hint at a further price pullback. Asian refiners have almost fulfilled their needs for spot cargoes after aggressive buying activity seen early this month, according to Bloomberg. This has resulted in a narrowing backwardation spread in January-February Dubai swaps. Abu Dhabi’s Murban crude was sold in the Asian spot market below its official price of the first time since August, signaling slower demand in the physical markets.
On the bright side, the US House and Senate have passed a giant spending bill which comprised of US$ 900 billion Covid-19 relief and a US$ 1.4 trillion in regular government funding alongside tax breaks for businesses. Markets have been expecting a stimulus plan to be passed this week, which may pave way for further USD weakness.
The US Dollar Index, which has historically displayed strong negative correlation with crude oil prices, has fallen back to 90.10 area on Tuesday. A continuously weakening USD as a result of accommodative monetary environment and fiscal supports may limit the extent of oil’s pullback, although demand concerns may serve to limit upside potential in the near term. The DXY US Dollar index and WTI have registered a negative correlation coefficient of -0.324 over the past 12 months (chart below).
WTI Crude Oil Prices vs. DXY US Dollar Index – Weekly
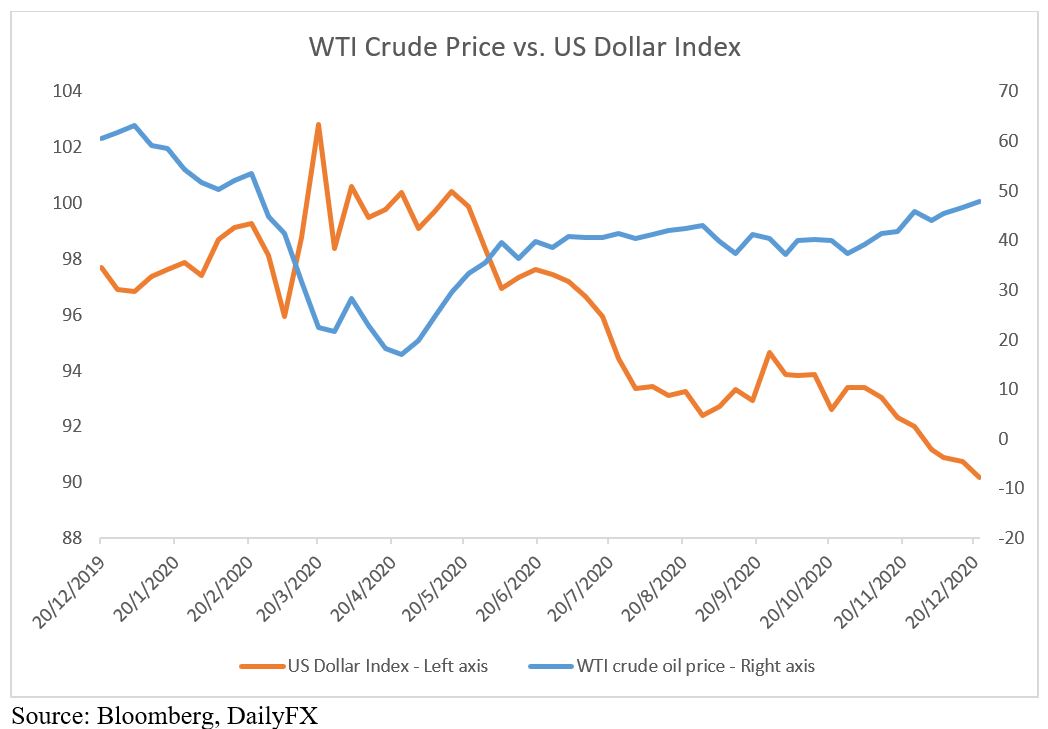
Source: Bloomberg, DailyFX
The prospects for a gradual rollout of vaccines around the globe, among other positive catalysts, have fueled a whopping 45% rally in WTI prices since early November. For now, more concrete evidences to support a turnaround in global energy demand might be needed to sustain its astonishing rally.
A summary of weekly petroleum data released by EIA last week pointed to a 0.25 million fall in the US crude oil refinery inputs, with refineries operating at 79.1% capacity during that week. US crude oil imports also decreased by 1.1 million barrelsper day from the previous week, showing weaker demand for energy as another pandemic wave hits. Total inventories are about 10% above the five year average for this time of year, whereas travel activity may take a longer time to revert to the pre-Covid perch.
Traders are anticipating a 3-million-barrel decline in US crude inventories for the week ending December 18th, with the actual data coming in on December 23rd. Last week, markets saw a 3.14-million-barrel draw in stockpiles, which only marked a small reversal of the 15.20 million barrel increase seen in the week earlier. Oil prices have historically displayed a negative correlation with inventories, with a past-12 month correlation coefficient of -0.422 (chart below).
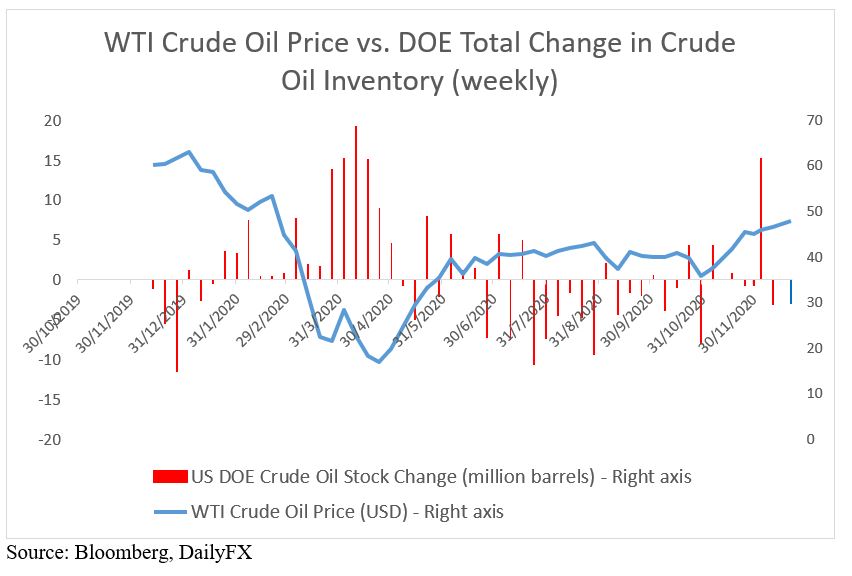
Source: Bloomberg, DailyFX

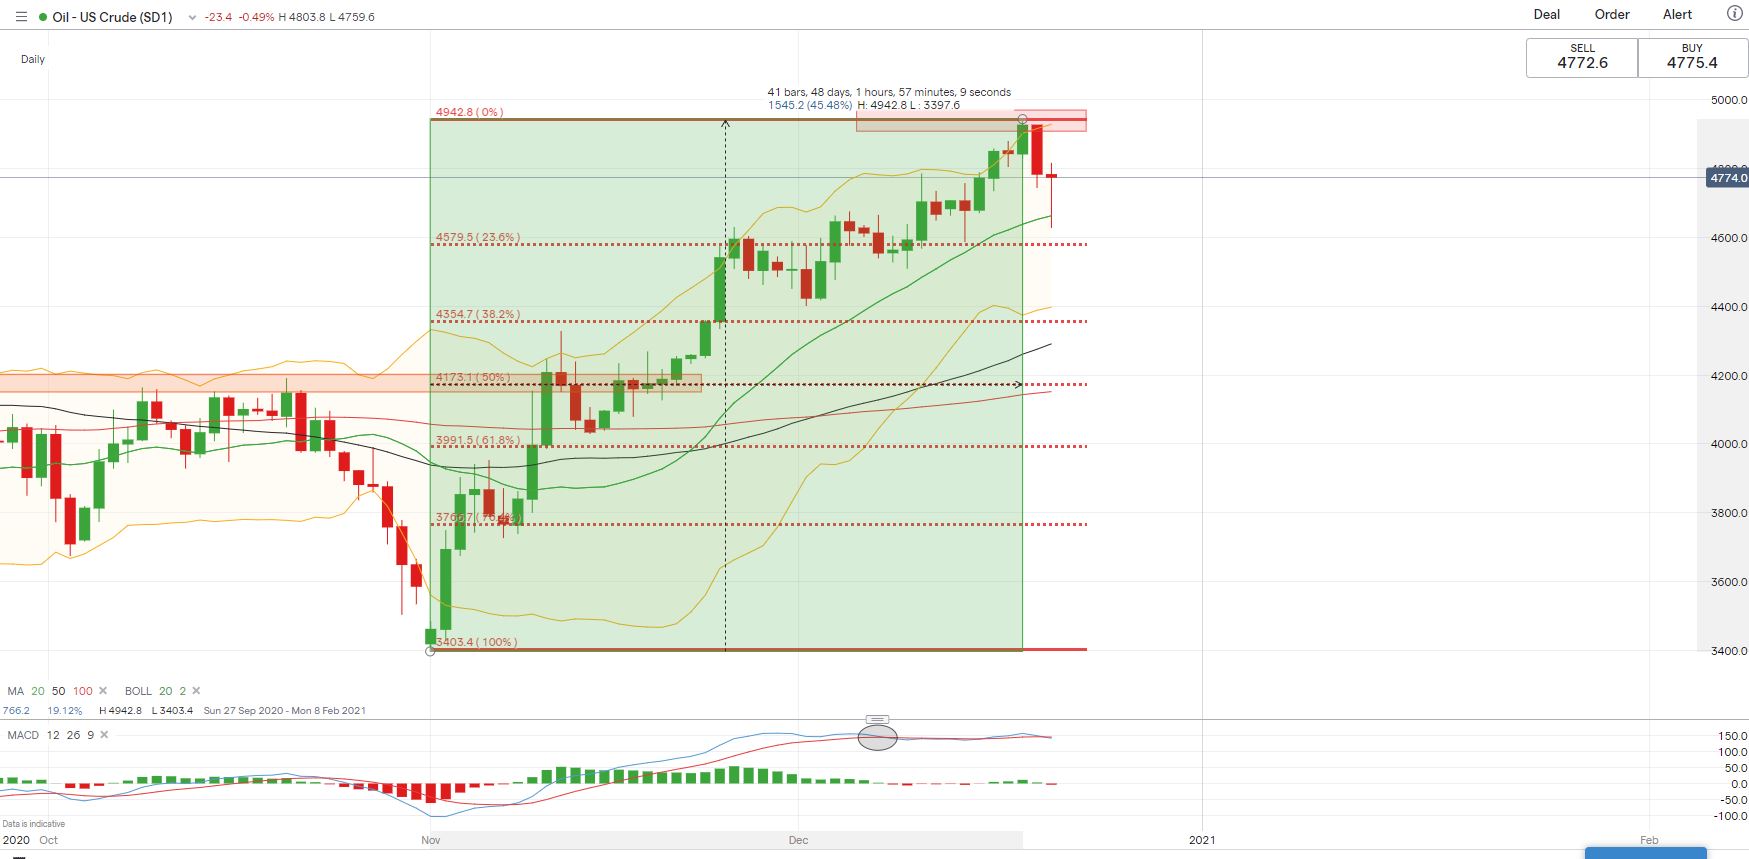
Technically, upward momentum appears to be faltering for WTI, with an MACD divergence observed on the daily chart. MACD divergence suggests fading momentum and flags risk for a pullback. An immediate resistance level can be found at US$ 49.40 – a recent high. A failed attempt to breach this level has resulted in a pullback to test its 20-Day SMA line. Breaking below the 20-Day SMA may open the door for further losses, with an eye on US$ 45.80 – the 23.6% Fibonacci retracement.
WTI Crude Oil Price – Daily Chart

--- Written by Margaret Yang, Strategist for DailyFX.com
To contact Margaret, use the Comments section below or @margaretyjy on Twitter


