


CRUDE OIL PRICE OUTLOOK:
- Crude oil prices reversed lower after hitting a chart resistance level at US$ 46.30
- Rapidly climbing US coronavirus cases weighed on the outlook for energy demand
- WTI may see a deeper pullback after forming a MACD Death Cross on the chart
WTI crude oil prices entered a brief consolidation after hitting a key chart resistance level at US$ 46.30. Oil traders appear to be defensive as sentiment turned sour after the US saw surging viral cases after the Thanksgiving holiday break.California reported a 69% surge in Covid-linked ICU cases alongside climbing hospitalizations over the past two weeks. Illinois and New York also recorded a bump in cases.The ascending trend of US coronavirus infections showed no sign of abating (chart below) and may result in an extension of lockdown measures leading into the Christmas holiday season.
US Daily New Covid-19 Cases
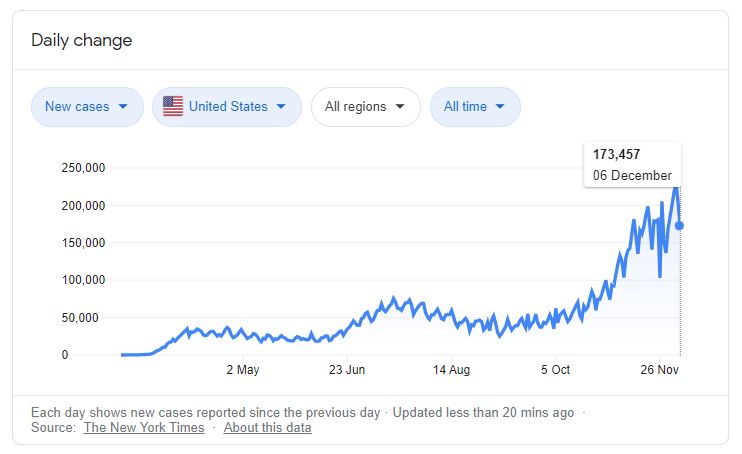
Source: Google
Although a few types of vaccines are on course to be rolled out, it may take a few months before they become widely available. Oil prices have likely priced-in a Biden-win election result, vaccine hopes as well as OPEC+ production hike resolution over the past month. A rapidly worsening viral situation in the US may dampen the near-term energy demand outlook and encourage unwinding activity after prices registered an astonishing 36% gain in November.
The US Dollar strengthened slightly as a result of haven buying, which further weighed on commodity prices. The DXY US Dollar index and WTI have registered a negative correlation coefficient of -0.258 over the past 12 months (chart below). The US Dollar index is hovering at a 2.5-year low and has entered technical oversold territory. A potential rebound in the Greenback may further suppress commodity prices.
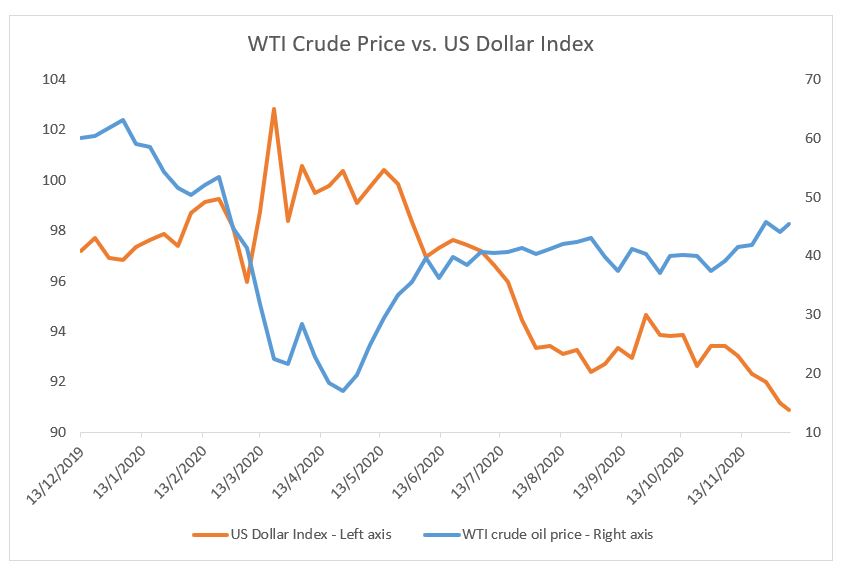
Source: Bloomberg, DailyFX
Traders are anticipating a 1-million-barrel decline in US crude inventories for the week ending December 4th, with the next EIA crude oil inventory report due on December 9th. A larger-than-expected decline may offer prices some support, whereas an unexpected build in stockpiles may encourage liquidation. Crude oil prices have historically displayed a negative correlation with inventories (chart below).
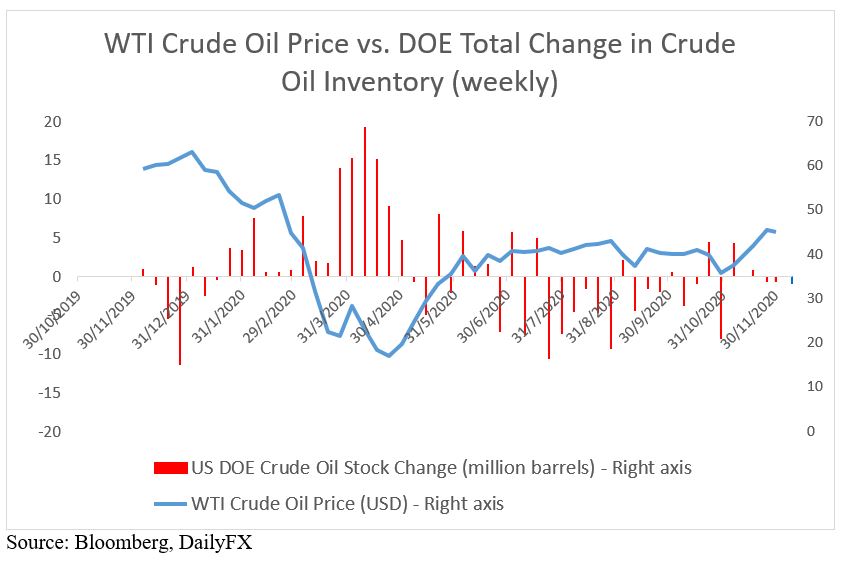
Source: Bloomberg, DailyFX

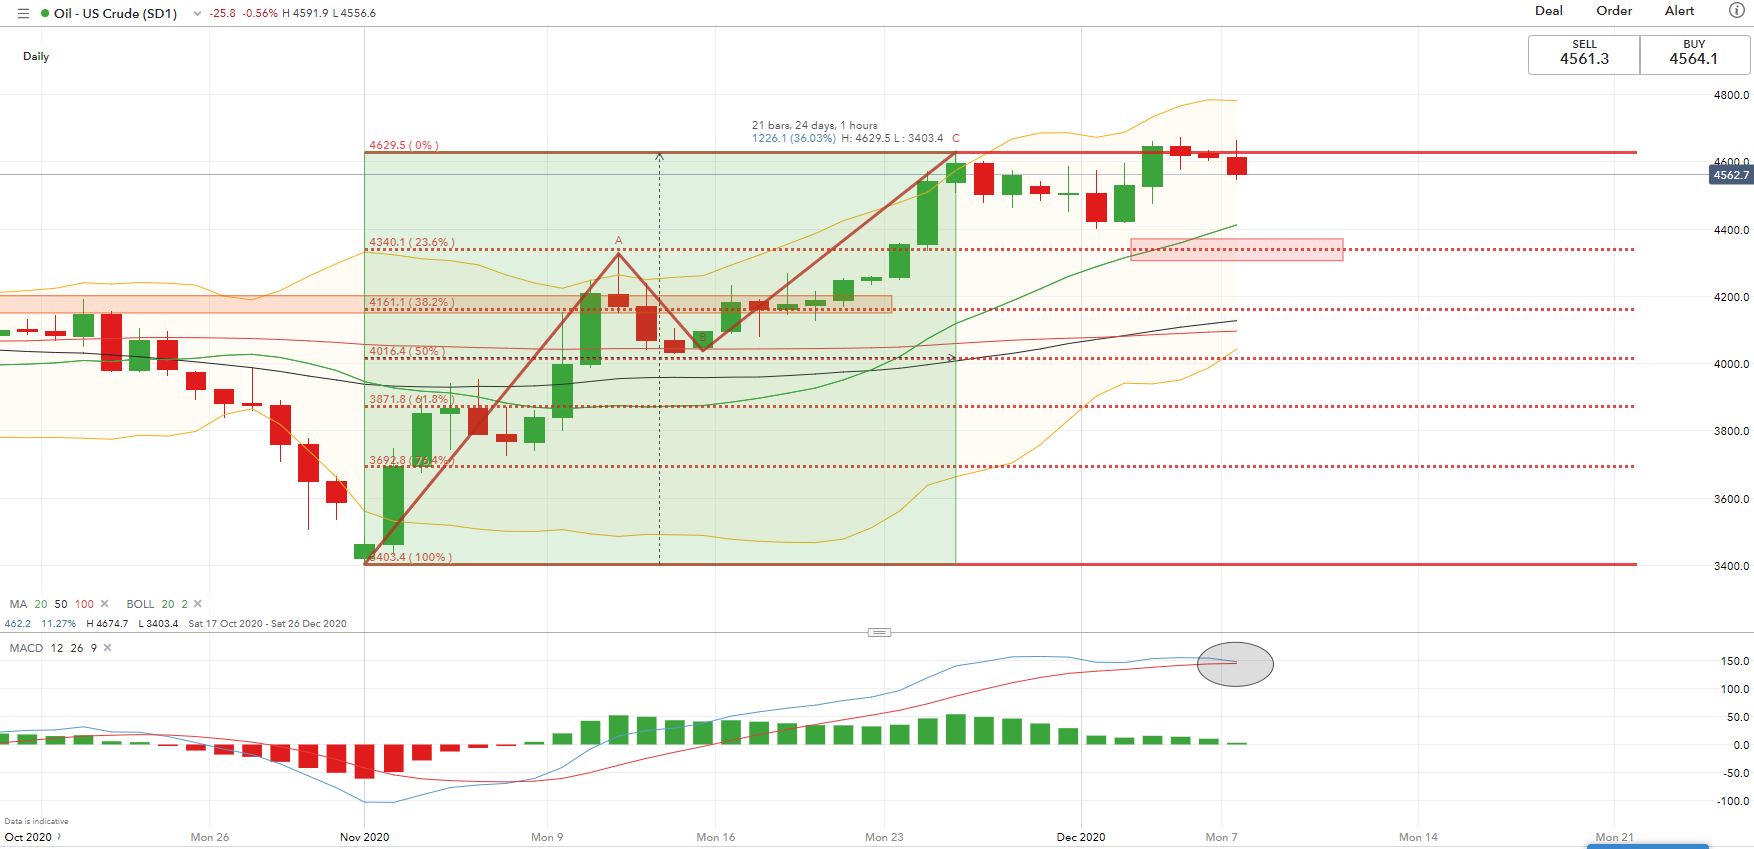
Technically, WTI has likely formed a bearish “AB=CD” pattern and since entered a consolidative period. Prices failed to break a key resistance at US$ 46.30 on a second attempt. More importantly, the MACD indicator has likely formed a “Death Cross”, which points to potential trend reversal. A deeper pullback from here may lead to a test of US$ 43.40 – the 23.6% Fibonacci retracement. Breaking this level may open the door for further losses with an eye on US$ 41.60. The RSI indicator has pulled back from overbought territory as price consolidates, pointing to more downside risk.
WTI Crude Oil Price – Daily Chart

--- Written by Margaret Yang, Strategist for DailyFX.com
To contact Margaret, use the Comments section below or @margaretyjy on Twitter


