


USDJPY Price, News and Analysis:
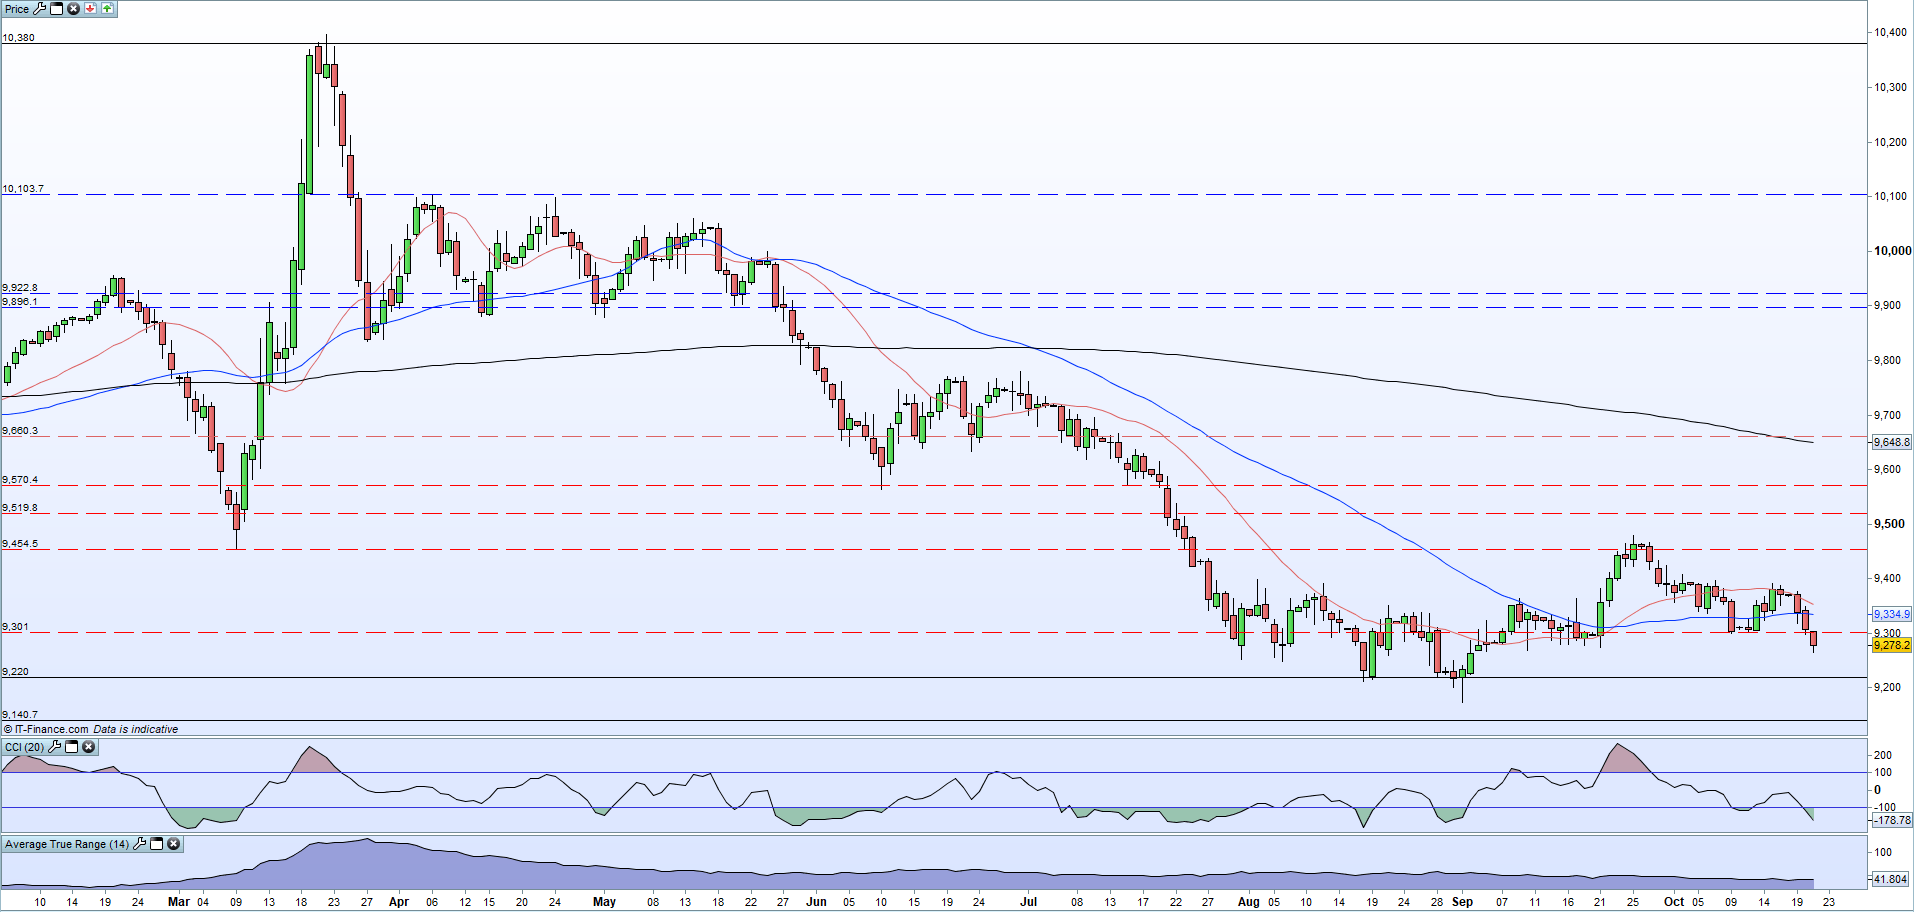
The US dollar continues to leak lower and the dollar basket (DXY) is now below a noted short-term support level around 93.00. The main driver of the move – as we mentioned here at the weekend – is the ongoing US stimulus bill discussion. Tuesday’s more positive tone for an agreement has weighed further on the US dollar and taken it through its short-term support. The DXY is looking oversold currently, so a small short-term rebound cannot be ruled out.
US Dollar (DXY) Daily Price Chart (February – October 21, 2020)

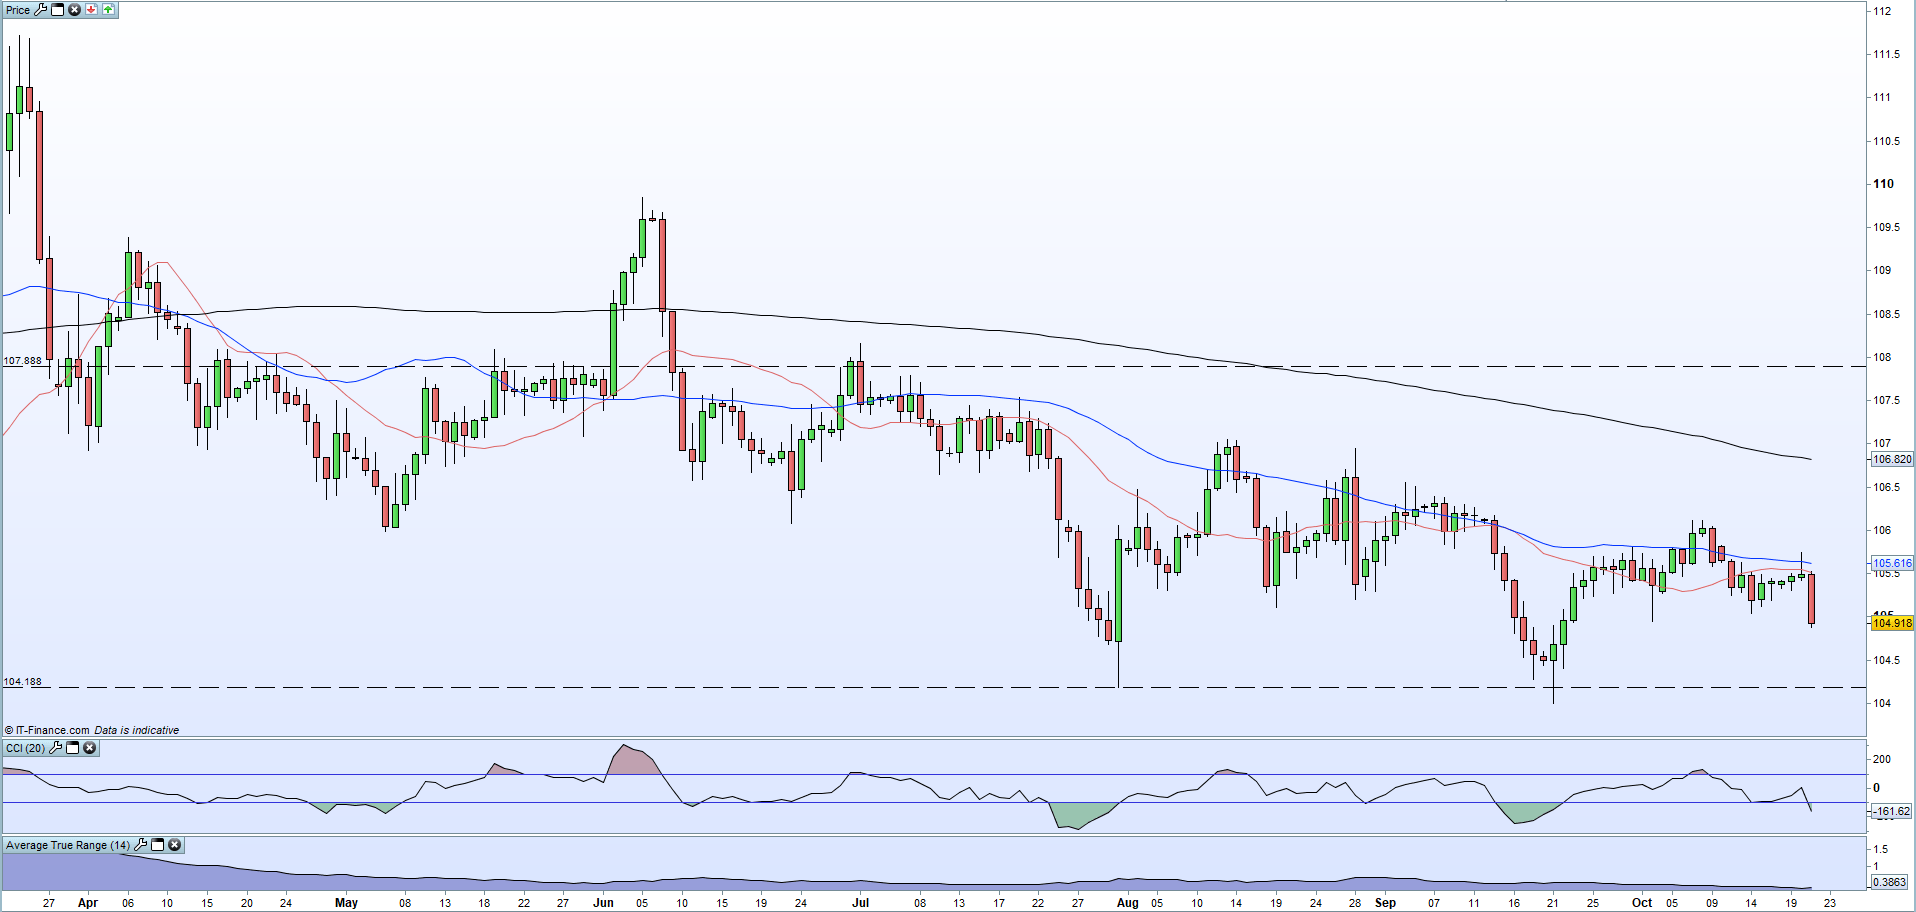
The Japanese Yen has pulled in a small bid today as well, exacerbating the move lower. A look at CHFJPY shows the recent run higher has stopped and turned lower today, suggesting that the Japanese Yen is today’s preferred safety play. USDJPY today touched a low of 104.87, a new one-month low and if sentiment remains negative, two recent swing-lows between 104.00 and 104.19 come into play. The CCI indicator suggests the market is oversold but not at recent extreme levels.

USDJPY Daily Price Chart (April – October 21, 2020)
| Change in | Longs | Shorts | OI |
| Daily | 56% | -17% | -1% |
| Weekly | 73% | -34% | -17% |
IG client data show 57.00% of traders are net-long with the ratio of traders long to short at 1.33 to 1.The number of traders net-long is 6.50% lower than yesterday and 8.93% lower from last week, while the number of traders net-short is 1.14% lower than yesterday and 8.98% lower from last week.
We typically take a contrarian view to crowd sentiment, and the fact traders are net-long suggests USD/JPY prices may continue to fall.Positioning is less net-long than yesterday but more net-long from last week. The combination of current sentiment and recent changes gives us a further mixed USD/JPY trading bias.
What is your view on the Japanese Yen – bullish or bearish?? You can let us know via the form at the end of this piece or you can contact the author via Twitter @nickcawley1.


