


XAU/USD PRICE OUTLOOK: GOLD SELLING STABILIZES NEAR 100-DAY MOVING AVERAGE AS MARKET SENTIMENT IMPROVES
- Gold jumped higher by 1% on Monday as precious metals aim to stabilize after falling sharply
- Gold price action likely hinges on fiscal stimulus speculation and broader liquidity conditions
- XAU/USD gained ground while the US Dollar Index pivoted lower amid recovering risk appetite
Gold prices edged 1% higher to start the week in an attempt to erase steep losses recorded over recent trading sessions. The precious metal has slid by nearly 5% month-to-date, but gold selling pressure seems to have stalled out near its 100-day moving average. Improving trader sentiment on the back of rekindled fiscal stimulus negotiations seems to be weighing negatively on the anti-risk US Dollar, which is likely propelling the advance by XAU/USD price action.

GOLD PRICE CHART WITH US DOLLAR INDEX OVERLAID: DAILY TIME FRAME (07 APR TO 28 SEP 2020)
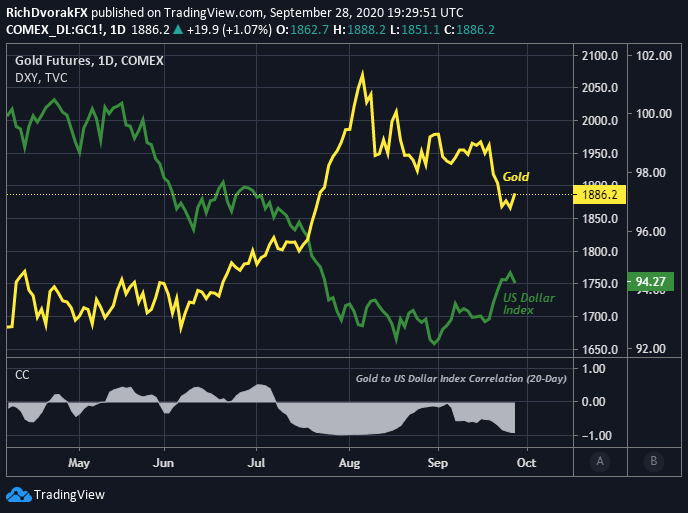
Chart created by @RichDvorakFX with TradingView
Generally speaking, there is a strong inverse relationship between gold prices and the US Dollar. This inverse relationship has strengthened notably this month with the gold to US Dollar correlation coefficient plunging to -0.91 from -0.11 clocked on 31 August. As such, the direction of the broader US Dollar Index could exert a greater influence on where gold price action trends next.

GOLD PRICE CHART: DAILY TIME FRAME (25 MAR TO 28 SEP 2020)
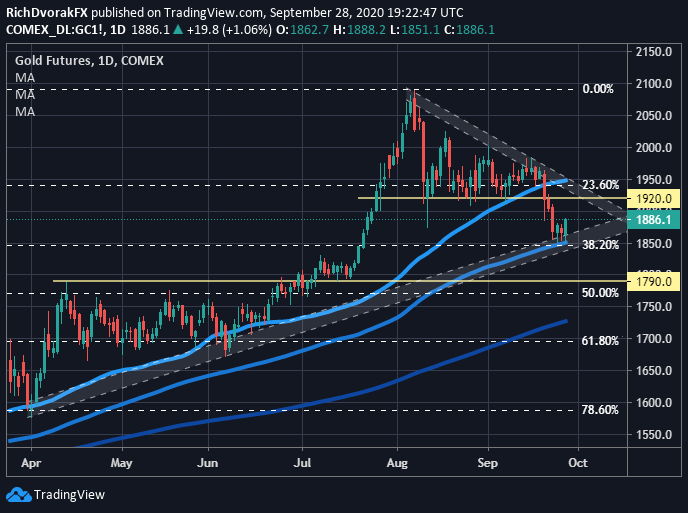
Chart created by @RichDvorakFX with TradingView
Gold might continue to face headwinds with the US Dollar showing signs of a bullish reversal amid an aggressive uptick in market volatility. That said, the 38.2% Fibonacci retracement level of this year’s trading range, as well as the 100-day simple moving average, have provided buoyancy to gold price action so far. Sustained improvement in market sentiment, likely accompanied by a deeper US Dollar pullback, could facilitate a larger rebound by XAU/USD.
| Change in | Longs | Shorts | OI |
| Daily | 4% | 2% | 3% |
| Weekly | 2% | -9% | -3% |
This could bring support-turned-resistance near the $1,920/oz price level into focus as a potential area where the precious metal might face renewed selling pressure. On the other hand, a breakdown in risk appetite and liquidity conditions could send traders flocking into safe-haven currencies like the US Dollar, which could bode poorly for gold. Taking out last week’s lows and slipping beneath the 100-day moving average increases the potential for gold to stretch even lower toward the $1,790-price level.
Keep Reading: Gold Price Forecast Bright & Volatile as USD, Real Yields Swing
-- Written by Rich Dvorak, Analyst for DailyFX.com
Connect with @RichDvorakFX on Twitter for real-time market insight


