
GBP price, FTSE 100, Brexit news and analysis:
- London stocks and the British Pound are again falling together despite the usual inverse correlation between the two markets.
- The FTSE 100 index is now technically oversold and due for a bounce although further losses are on the cards once the correction is over.
- As well as coronavirus fears, the approach of post-Brexit talks between the EU and the UK is making traders in UK assets nervous.
GBP/USD and FTSE 100 unnerved by coronavirus and Brexit
GBP/USD and the FTSE 100 index of leading London-listed stocks are again falling together despite the usual inverse correlation between the two assets. While the FTSE in particular now looks technically oversold and due for a near-term bounce, the outlook remains poor for both Sterling and the FTSE on fears about the spread of the coronavirus and nervousness ahead of talks on the future relationship between the UK and the EU that begin Monday.
The chances of a global recession have now risen substantially because of the impact of Covid-19. Moreover, investors in both the Pound and London stocks will likely remain nervous as the post-Brexit negotiations begin – with UK Prime Minister Boris Johnson seemingly ready to walk away from the talks and prepare for the UK to leave the EU without a deal at the end of this year if sufficient progress is not made by June, according to a new document setting out the UK Government’s stance in the negotiations.
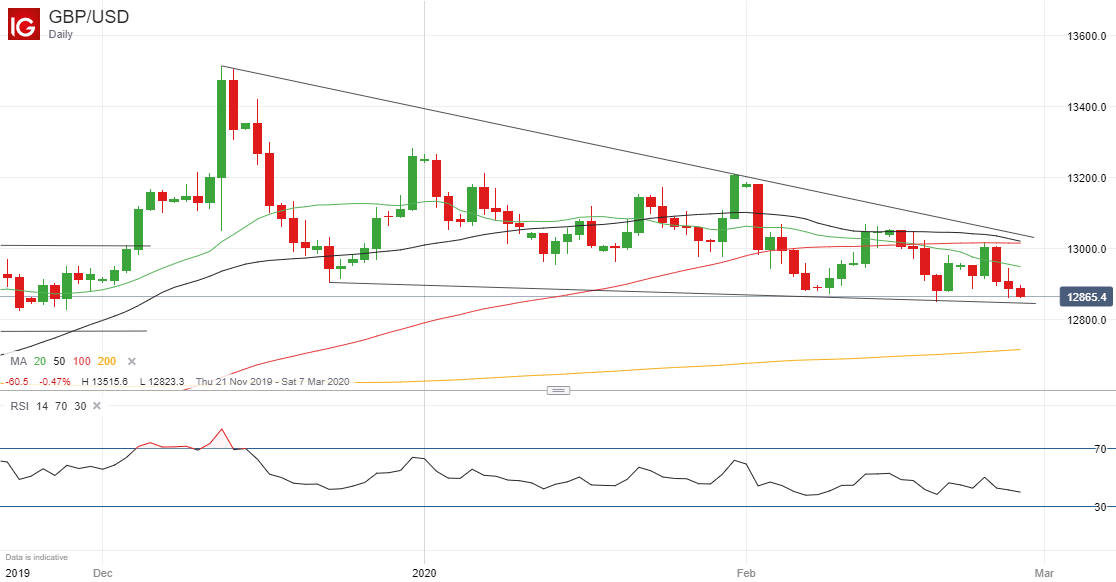
GBP/USD Price Chart, Daily Timeframe (November 21, 2019 – February 28, 2020)
| Change in | Longs | Shorts | OI |
| Daily | 3% | 2% | 2% |
| Weekly | -33% | 40% | 0% |
Chart by IG (You can click on it for a larger image)
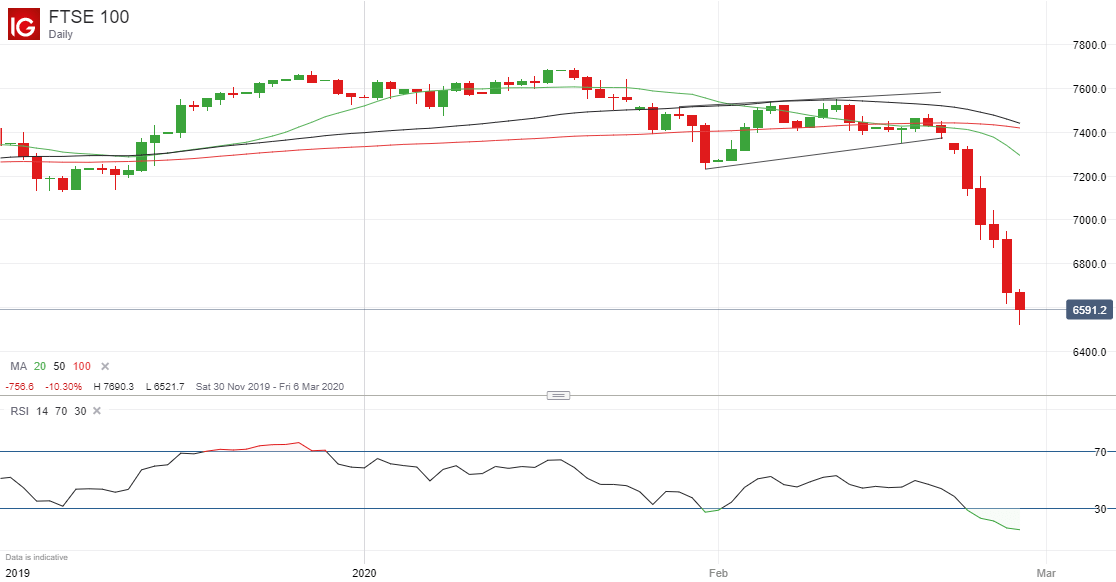
As the chart above shows, GBP/USD has now fallen for three successive sessions but is not yet oversold. By contrast, the FTSE 100, which has dropped for eight sessions in a row, is now heavily oversold as measured by the relative strength index shown at the bottom of the chart below, now well under the 30 level that signals an oversold market.
FTSE 100 Price Chart, Daily Timeframe (November 29, 2019 – February 28, 2020)
| Change in | Longs | Shorts | OI |
| Daily | 1% | 0% | 0% |
| Weekly | 39% | -3% | 3% |
A near-term FTSE correction higher would be no surprise but, longer-term, it is hard to see a sustained rally given coronavirus, recession fears and the talks on the future relationship between the UK and the EU that are likely to emphasize how far apart the two sides are.
We look at Sterling regularly in the DailyFX Trading Global Markets Decoded podcasts that you can find here on Apple or wherever you go for your podcasts
--- Written by Martin Essex, Analyst and Editor
Feel free to contact me via the comments section below