


Gold Price Analysis and Talking Points
See our quarterly gold forecast to learn what will drive prices throughout Q3!
Gold & Silvers Prices Find Support Post FOMC Drop
Yesterday, the Federal Reserve cut interest rates to 1.75-2.00% as expected. However, the mixed outlook in regard to the future path of interest rates among the committee with 7/17 expecting rates to be lowered again slightly disappointed the dovish market expectations. Therefore, gold and silver prices slipped in the wake of the decision as markets interpreted this signal as hawkish.
US-China Trade Wars in Focus
With the Federal Reserve out of the way, much of the focus rests on between US and Chinese trade representatives, in which the outcome is likely to drive near-term price action for the precious metals complex. In the run up to China’s important political event in the form of the 70th anniversary of the Peoples Republic of China on October 1st, trade tensions have eased as both China and the US have provided good will gestures. Consequently, expectations of an interim trade deal between the two party have grown with reports in the South China Morning Post confirming as much. If indeed an interim trade deal were to come to fruition this could pressure safe-havens.
GOLD PRICE CHART: Daily Time-Frame (May 2018 – Sep 2019)
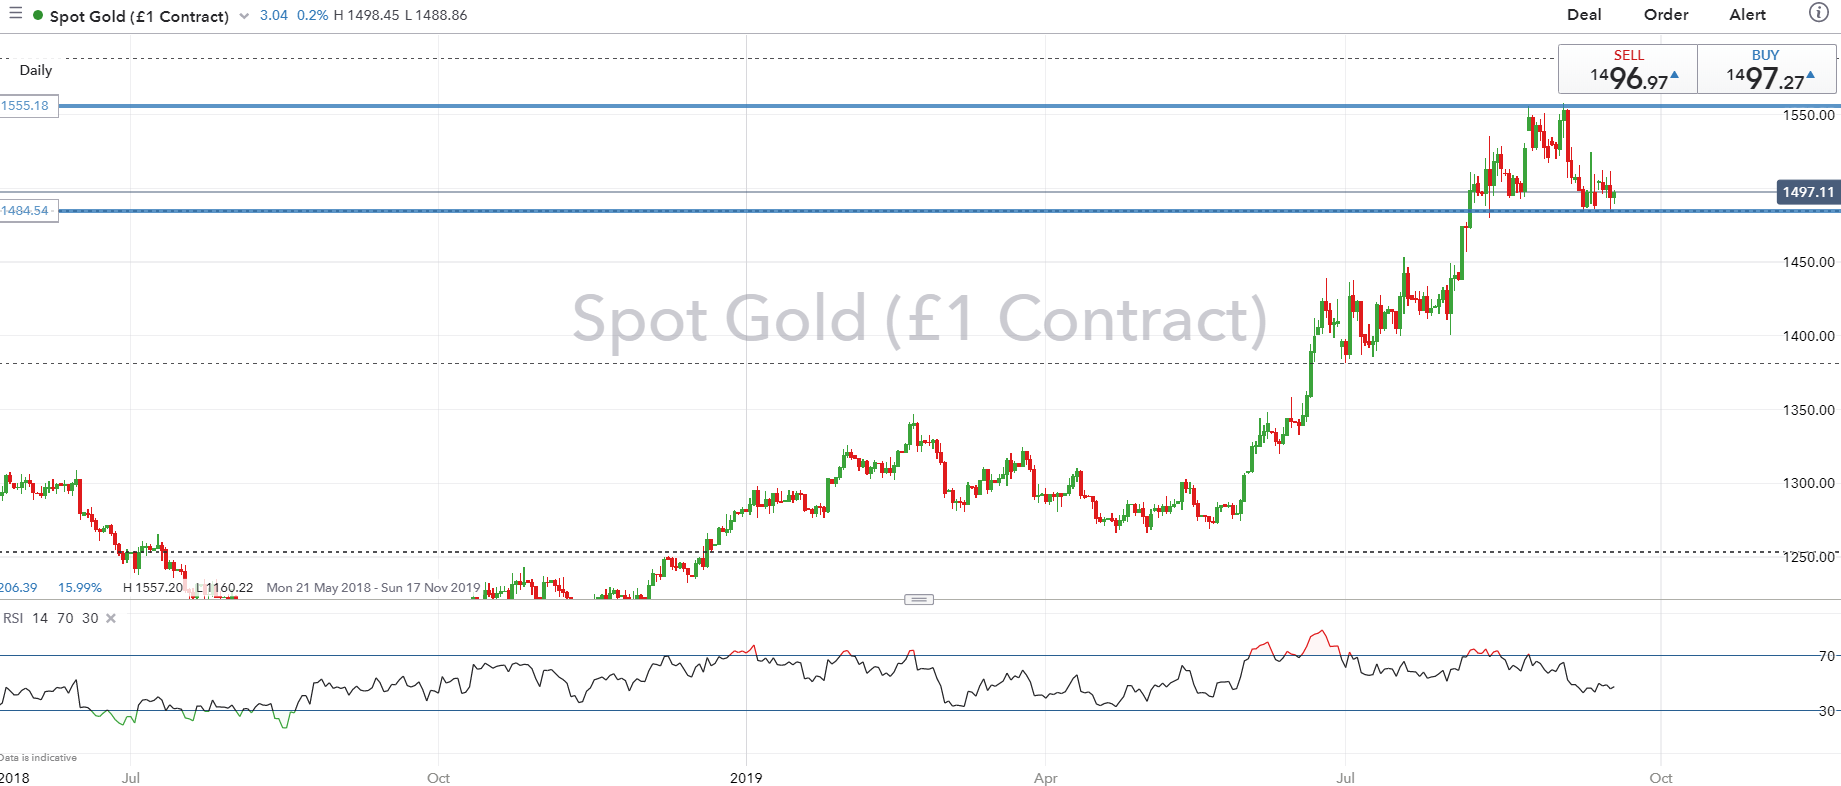
Gold prices have bounced of the key $1480-85 support zone to make another test of the psychological $1500 level. On the topside, resistance is situated at $1510, whereby a break above opens the door to $1525.
SILVER PRICE CHART: Daily Time-Frame (May 2018 – Sep 2019)
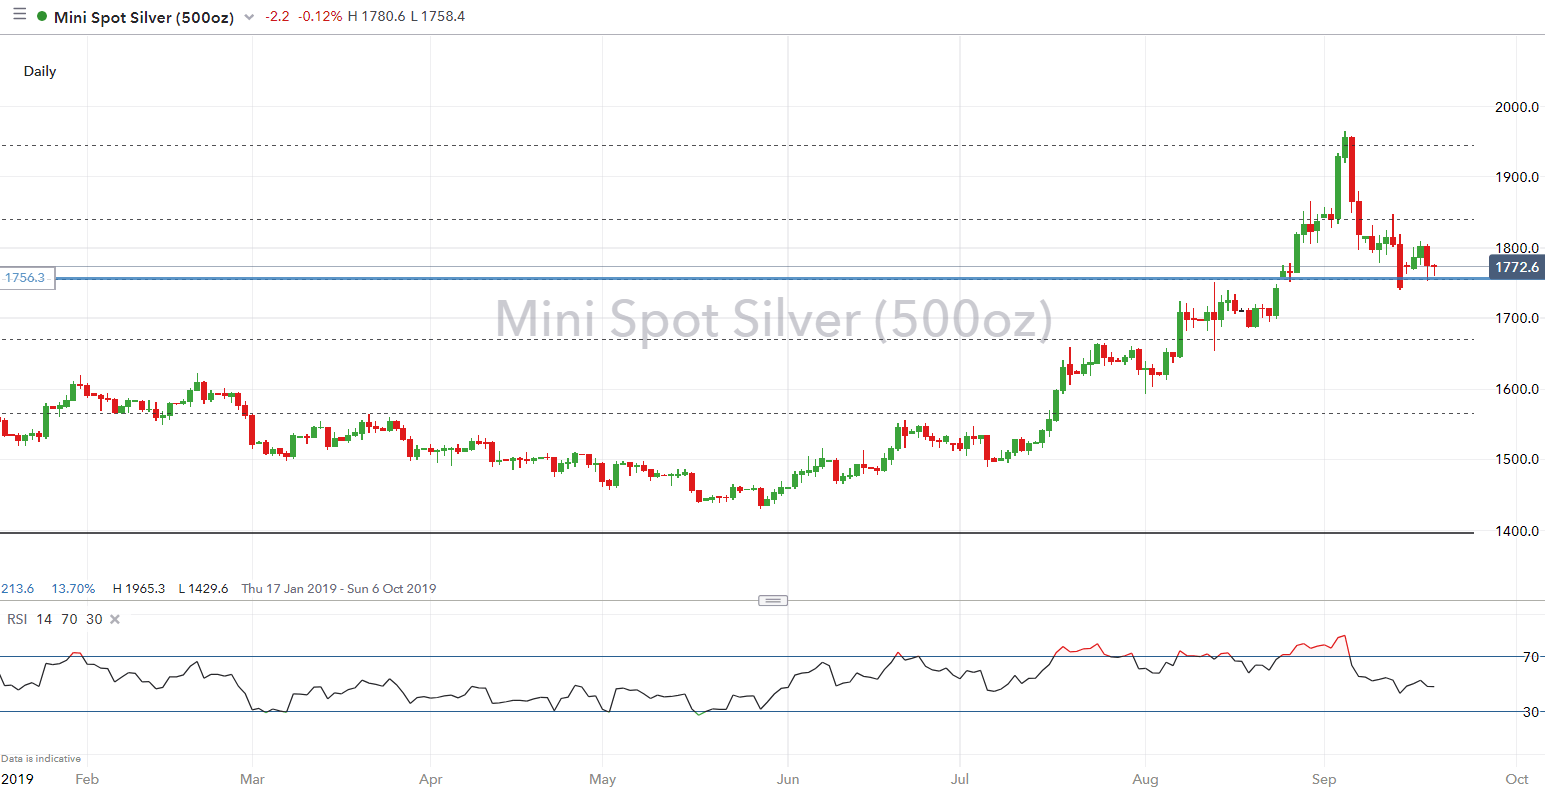
A support zone at $17.50-55 have underpinned the precious metal, however, with resistance at $18, gains could be somewhat limit unless risk sentiment sours.
GOLD TRADING RESOURCES:
- See our quarterly gold forecast to learn what will drive prices through mid-year!
- Just getting started? See our beginners’ guide for FX traders
- Having trouble with your strategy? Here’s the #1 mistake that traders make
--- Written by Justin McQueen, Market Analyst
To contact Justin, email him at Justin.mcqueen@ig.com
Follow Justin on Twitter @JMcQueenFX


