


Bitcoin (BTC) and Ethereum (ETH): Prices, Charts and Technical Analysis
- Bitcoin shows signs of stabilizing but needs to break above its recent lower high.
- Ethereum still remains negative and needs to build a base if it is to break higher.
Bitcoin and Ethereum – A Tale of Two Charts
The recent bear market in the cryptocurrency space will have been drawn in some crypto-bulls with lower prices looking enticing, but the charts still paint an overall negative picture. If we look at the the two largest coins, Bitcoin and Ethereum, one looks like it is still steadily building a base, while the other has no positive technical signals.
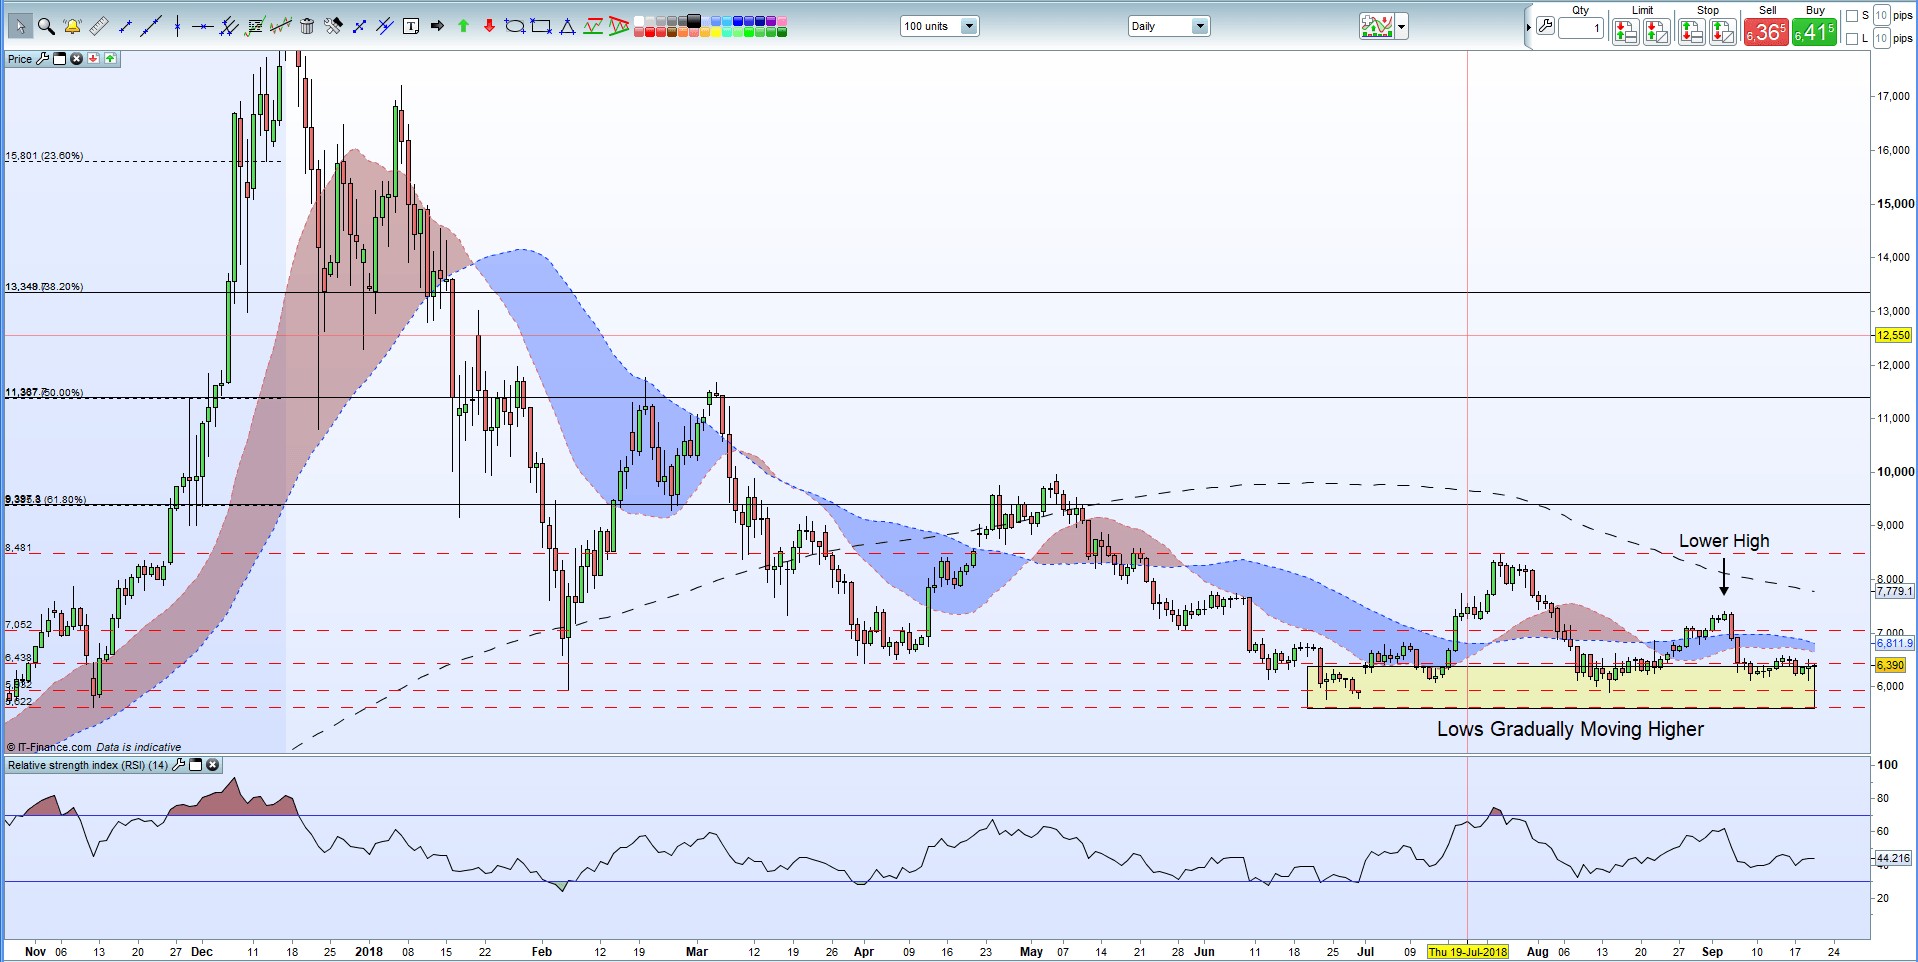
Bitcoin (BTC) made a year-to-date low of $5,769 on June 24 and then moved back above $6,000 around six weeks ago and has respected this level ever since. While the daily chart still has negative overtones, this base building does point to a market that is finding short-term equilibrium and is levelling out, for now. For the chart to break this negative trend, BTC needs to break back above the recent lower high at $7,404 and consolidate above this level.A break below $5,769 negates this view and suggests lower prices.
One of our most popular articles on this subject explains Lower Highs/Higher Lows in more depth – Buy the Higher Low and Sell the Lower High
Bitcoin (BTC) Daily Price Chart (November 2017 – September 20, 2018)
Ethereum (ETH) another crypto that has seen sharp falls has a different chart set-up to Bitcoin and still remains negative. As the daily chart below shows, there has been no signs of any price equilibrium or base building. Lower highs remain dominant while the recent bounce from the ytd low at $167 looks unconvincing for now. For Ethereum to gain any positive sentiment it needs to remain convincingly above the September 12 low and break back above the September 2, marginal, lower high at $304.
Ethereum (ETH) Daily Price Chart (March 14 – September 20, 2018)

Cryptocurrency articles this week:
Bitcoin Cash and Ethereum Price News: Further Falls Ahead
Bitcoin, Ethereum, Ripple Prices: Bears Remain in Control
Cryptocurrency Trader Resources
If you are interested in trading Bitcoin, Bitcoin Cash, Ethereum, Litecoin or Ripple we can help you begin your journey with our Introduction to Bitcoin Trading Guide.
What’s your opinion on the latest market crash? Share your thoughts and ideas with us using the comments section at the end of the article or you can contact me on Twitter @nickcawley1 or via email at nicholas.cawley@ig.com.
--- Written by Nick Cawley, Analyst.


