


US Dollar Forecast Overview:
- The US Dollar (via the DXY Index) has seen topside price action falter in recent days, with dojis and inverted hammers forming against the June 22 bearish key reversal.
- Signs that the US economy will lag its developed counterparts in economic recover are leaving the US Dollar in a vulnerable position.
- Retail trader positioning suggests that USD/JPY rates may rally further, even though the market is net-long.

US Dollar’s Weak Topside Efforts
The US Dollar (via the DXY Index) has had quite the volatile year, but very little to show for it now that the calendar has turned the page into the second half of 2020. While finishing the first half of the year up by less than +1%, the US Dollar actually traded in a near 9% range between 94.65 and 102.99.
Coming into the second half of the year, price action appears to be weak. The end of June offered weak attempts to build on the recent rebound off of the lows, with sellers coming in and carving out dojis and inverted hammers against the June 22 bearish key reversal (more on that below). Ahead of the June US nonfarm payrolls report, one which will be highly volatile unto itself, as well as the long holiday weekend in the United States, there seems to be few compelling reasons for traders to stay long the greenback.
US Treasury Yield Curve Offers No Support for Dollar
While the US Treasury yield curve remains normalized at the very front-end – 1-month bills are no longer yielding more than their equivalents out to 2-year notes –this normalization is a direct result the extraordinary policy steps taken by the Federal Reserve.
After all, as we learned from The Great Recession, companies that are facing liquidity issues in the short-term can easily be swept up in the tides of insolvency if aggressive, heavy handed measures are not taken swiftly and upfront; the policy response cannot be a slow drip.
US Treasury Yield Curve: 1-month to 30-years (July 1, 2020) (Chart 1)
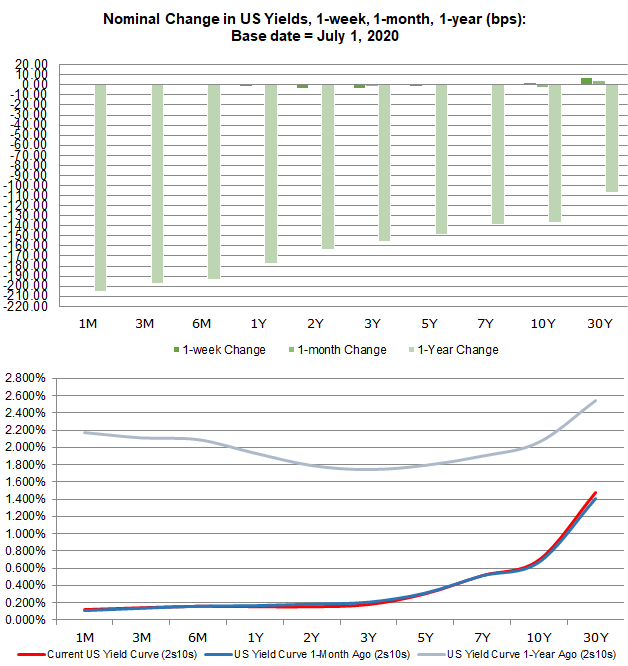
Markets are starting to feel that risk to the US economy is rising again: relatively speaking, 3-month to 12-month/1-year yields are higher today than they were one week ago, while the 2-year and 3-year yields have fallen. This twisting of the yield curve is hidden within the bear steepening, suggesting that there remains some discomfort among investors, a reflection borne out by stocks in recent weeks. We’ve previously noted, “for all the excitement in equity markets…credit is still suggesting that we’re not out of the woods just yet.” This remains to be the case.
Markets Looking Beyond Interest Rate Lever for Federal Reserve
Nothing has changed with respect to the Federal Reserve, having enacted emergency interest rate cut measures.Rate markets are more or less stuck in a state of suspended animation. If the Fed is going to do anything from here on out, it’s going to come via more QE, a repo facility, etc. The latest extraordinary effort, the Municipal Liquidity Facility, is an example of this effort.
Federal Reserve Interest Rate Expectations (July 1, 2020) (Table 1)
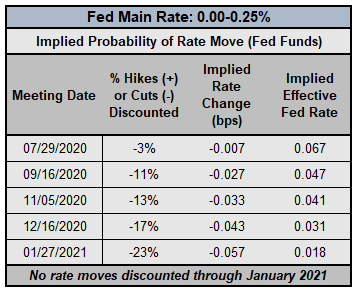
There’s been no indication that the Fed plans on moving rates into negative territory, and as a result, we’ve reached the lower bound for the time being. To this end, any suggestions by rates markets that a rate hike is coming anytime soon is a pricing quirk to be ignored: interest rates are not going anywhere higher, at least through January 2021.
DXY PRICE INDEX TECHNICAL ANALYSIS: WEEKLY CHART (November 2016 to July 2020) (CHART 2)
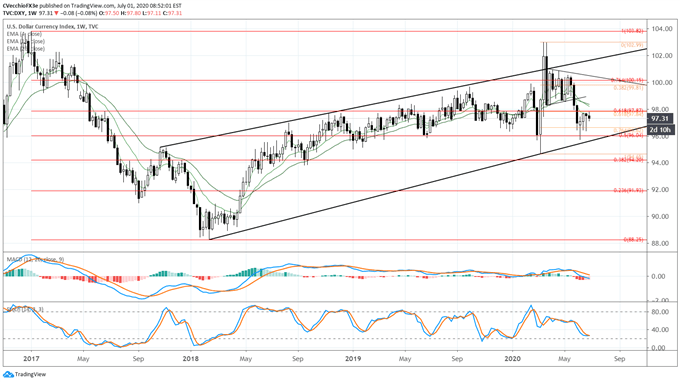
A review of the weekly timeframe draws our focus to the rising channel from the February 2018 low and the March 2020 low. In a prior update it was noted that “To this end, the loss of the multi-month consolidation, in context of failure to climb through channel resistance, suggests that a deeper pullback towards channel support may be in the works. Over the next few weeks, traders may look as far as the 50% retracement of the 2017 high/2018 low range at 96.04 as significant support.”
Now that the 50% retracement has been achieved, traders should be on alert for a potential channel breakdown that would suggest more significant losses over the coming months – perhaps towards 88.00.
DXY PRICE INDEX TECHNICAL ANALYSIS: DAILY CHART (July 2019 to July 2020) (CHART 3)
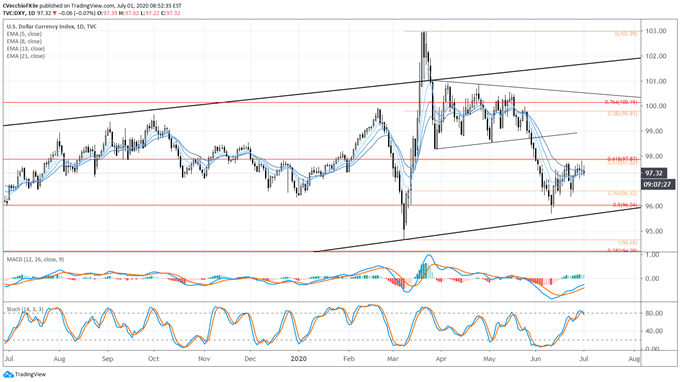
The DXY Index’s recovery in the second half of June lacked any significant effort, with several doji candles and inverted hammers forming against the June 22 bearish key reversal. To this end, the DXY Index was rejected in its attempt to rally above not only the 61.8% retracement (97.84) of the 2020 low/high range, but the 61.8% retracement (97.87) of the 2017 high/2018 low range as well.
Bearish momentum is starting to build, with price slipping below the daily 5-, 8-, 13-, and 21-EMA envelope, which remains in bearish sequential order. Daily MACD’s ascent in bearish territory is slowing, while Slow Stochastics have dropped out of overbought territory: contextually, the last time Slow Stochastics were in overbought territory, the DXY Index was trading near 100.00; now it is at 97.32. More losses cannot be ruled out in the near-term.
IG Client Sentiment Index: USD/JPY RATE Forecast (July 1, 2020) (Chart 4)
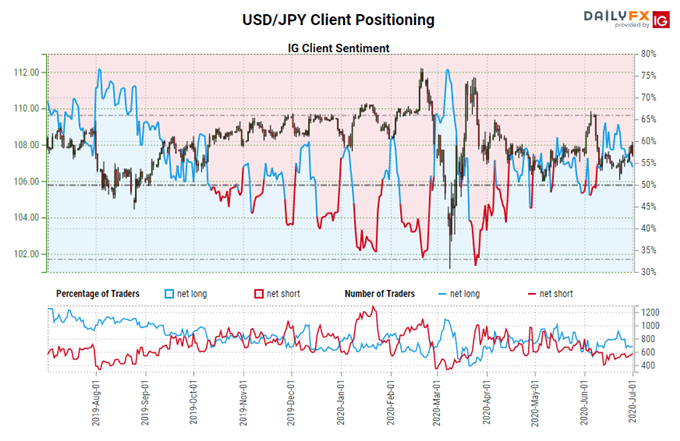
USD/JPY: Retail trader data shows 51.01% of traders are net-long with the ratio of traders long to short at 1.04 to 1. The number of traders net-long is 8.54% lower than yesterday and 18.45% lower from last week, while the number of traders net-short is 9.12% higher than yesterday and 10.22% higher from last week.
We typically take a contrarian view to crowd sentiment, and the fact traders are net-long suggests USD/JPY prices may continue to fall.
Yet traders are less net-long than yesterday and compared with last week. Recent changes in sentiment warn that the current USD/JPY price trend may soon reverse higher despite the fact traders remain net-long.

--- Written by Christopher Vecchio, CFA, Senior Currency Strategist


