


Dow Jones Industrial Average, S&P 500, Federal Reserve, US Treasuries, Inflation – Talking Points:
- Equity market plunged lower during the APAC session as risk-appetite notably faded.
- The upcoming speech from Fed Chair Jerome Powell will likely dictate the near-term trajectory of US benchmark equity indices.
- The Dow Jones and S&P 500 are both sitting atop key support ahead of the Chairman’s speech.
Asia-Pacific Recap
Equity markets plunged lower during Asia-Pacific trade, as surging bond yields fuelled concerns that central banks may begin tightening monetary policy levers sooner-than-expected. Australia’s ASX 200 fell 0.84%, while Japan’s Nikkei 225 plunged 2.13%. China’s CSI 300 toppled 3.14% and Hong Kong’s Hang Seng Index dropped 2.2%.
In FX markets, the cyclically-sensitive AUD, NZD, CAD and NOK largely outperformed, while the haven-associated USD and JPY slipped lower. Gold and silver prices recovered lost ground as yields on US 10-year Treasuries dipped 2-basis points lower.
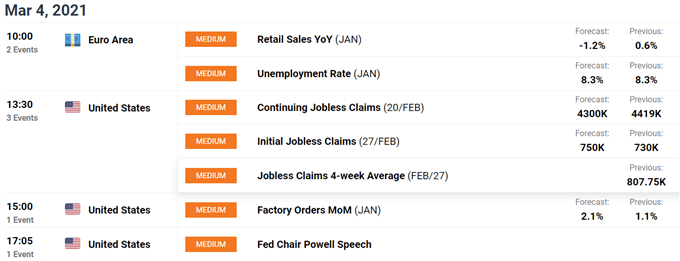
Looking ahead, a speech from Federal Reserve Chair Jerome Powell headlines the economic docket alongside US jobless claims figures and Euro-area retail sales data.
Fed Chair’s Upcoming Speech to Determine Risk Appetite
US benchmark equity indices have slid lower in recent days, as surging bond yields call into question rather lofty valuations and gnaw at risk appetite. The Dow Jones has slid 3.8% lower from its yearly high, while the S&P 500 and tech-heavy Nasdaq fell 4.6% and 9.9% respectively.
This aggressive shift in market sentiment appears to be driven by the notable rise in US Treasury yields, as investors bet on the Federal Reserve having to hike rates earlier-than-expected, and continue to price in substantial fiscal support from the Biden administration. The President is expected to succeed in passing his $1.9 trillion coronavirus-relief package through the reconciliation process, and follow that up with an infrastructure spending plan as large as $3 trillion.
This overwhelming fiscal response has sparked concerns that an aggressive spike in inflation is around the corner. Indeed, 5-year breakeven inflation rates have soared to the highest levels since 2008 in recent days, as markets price in consumer price growth above the Federal Reserve’s mandated 2% target.
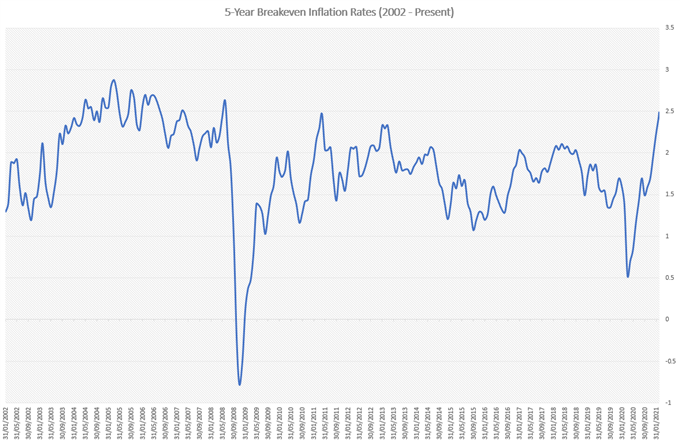
Data Source – Bloomberg
However, it seems relatively unlikely that the Federal Reserve will taper its monetary policy measures anytime soon, given Chairman Jerome Powell’s recent comments that “the economy is a long way from our employment and inflation goals”, adding that “inflation dynamics do change over time but they don’t change on a dime, and so we don’t really see how a burst of fiscal support or spending that doesn’t last for years would actually change those inflation dynamics”.
Nevertheless, yields may continue to climb in the near term if the Federal Reserve maintains its current monetary policy settings. This may in turn result in an extend period of risk aversion and undermine benchmark equity indices in the coming weeks.
With that in mind, attention now turns to Chairman Jerome Powell’s upcoming speech, with a lack of concern surrounding the recent sell-off in Treasury markets probably sending yields higher and undermining the Dow Jones and S&P 500.
On the other hand, any mention of the potential imposition of yield curve control (YCC), or increasing that rate of the central bank’s bond purchasing program, could buoy bond prices and open the door for stock prices to recover lost ground.
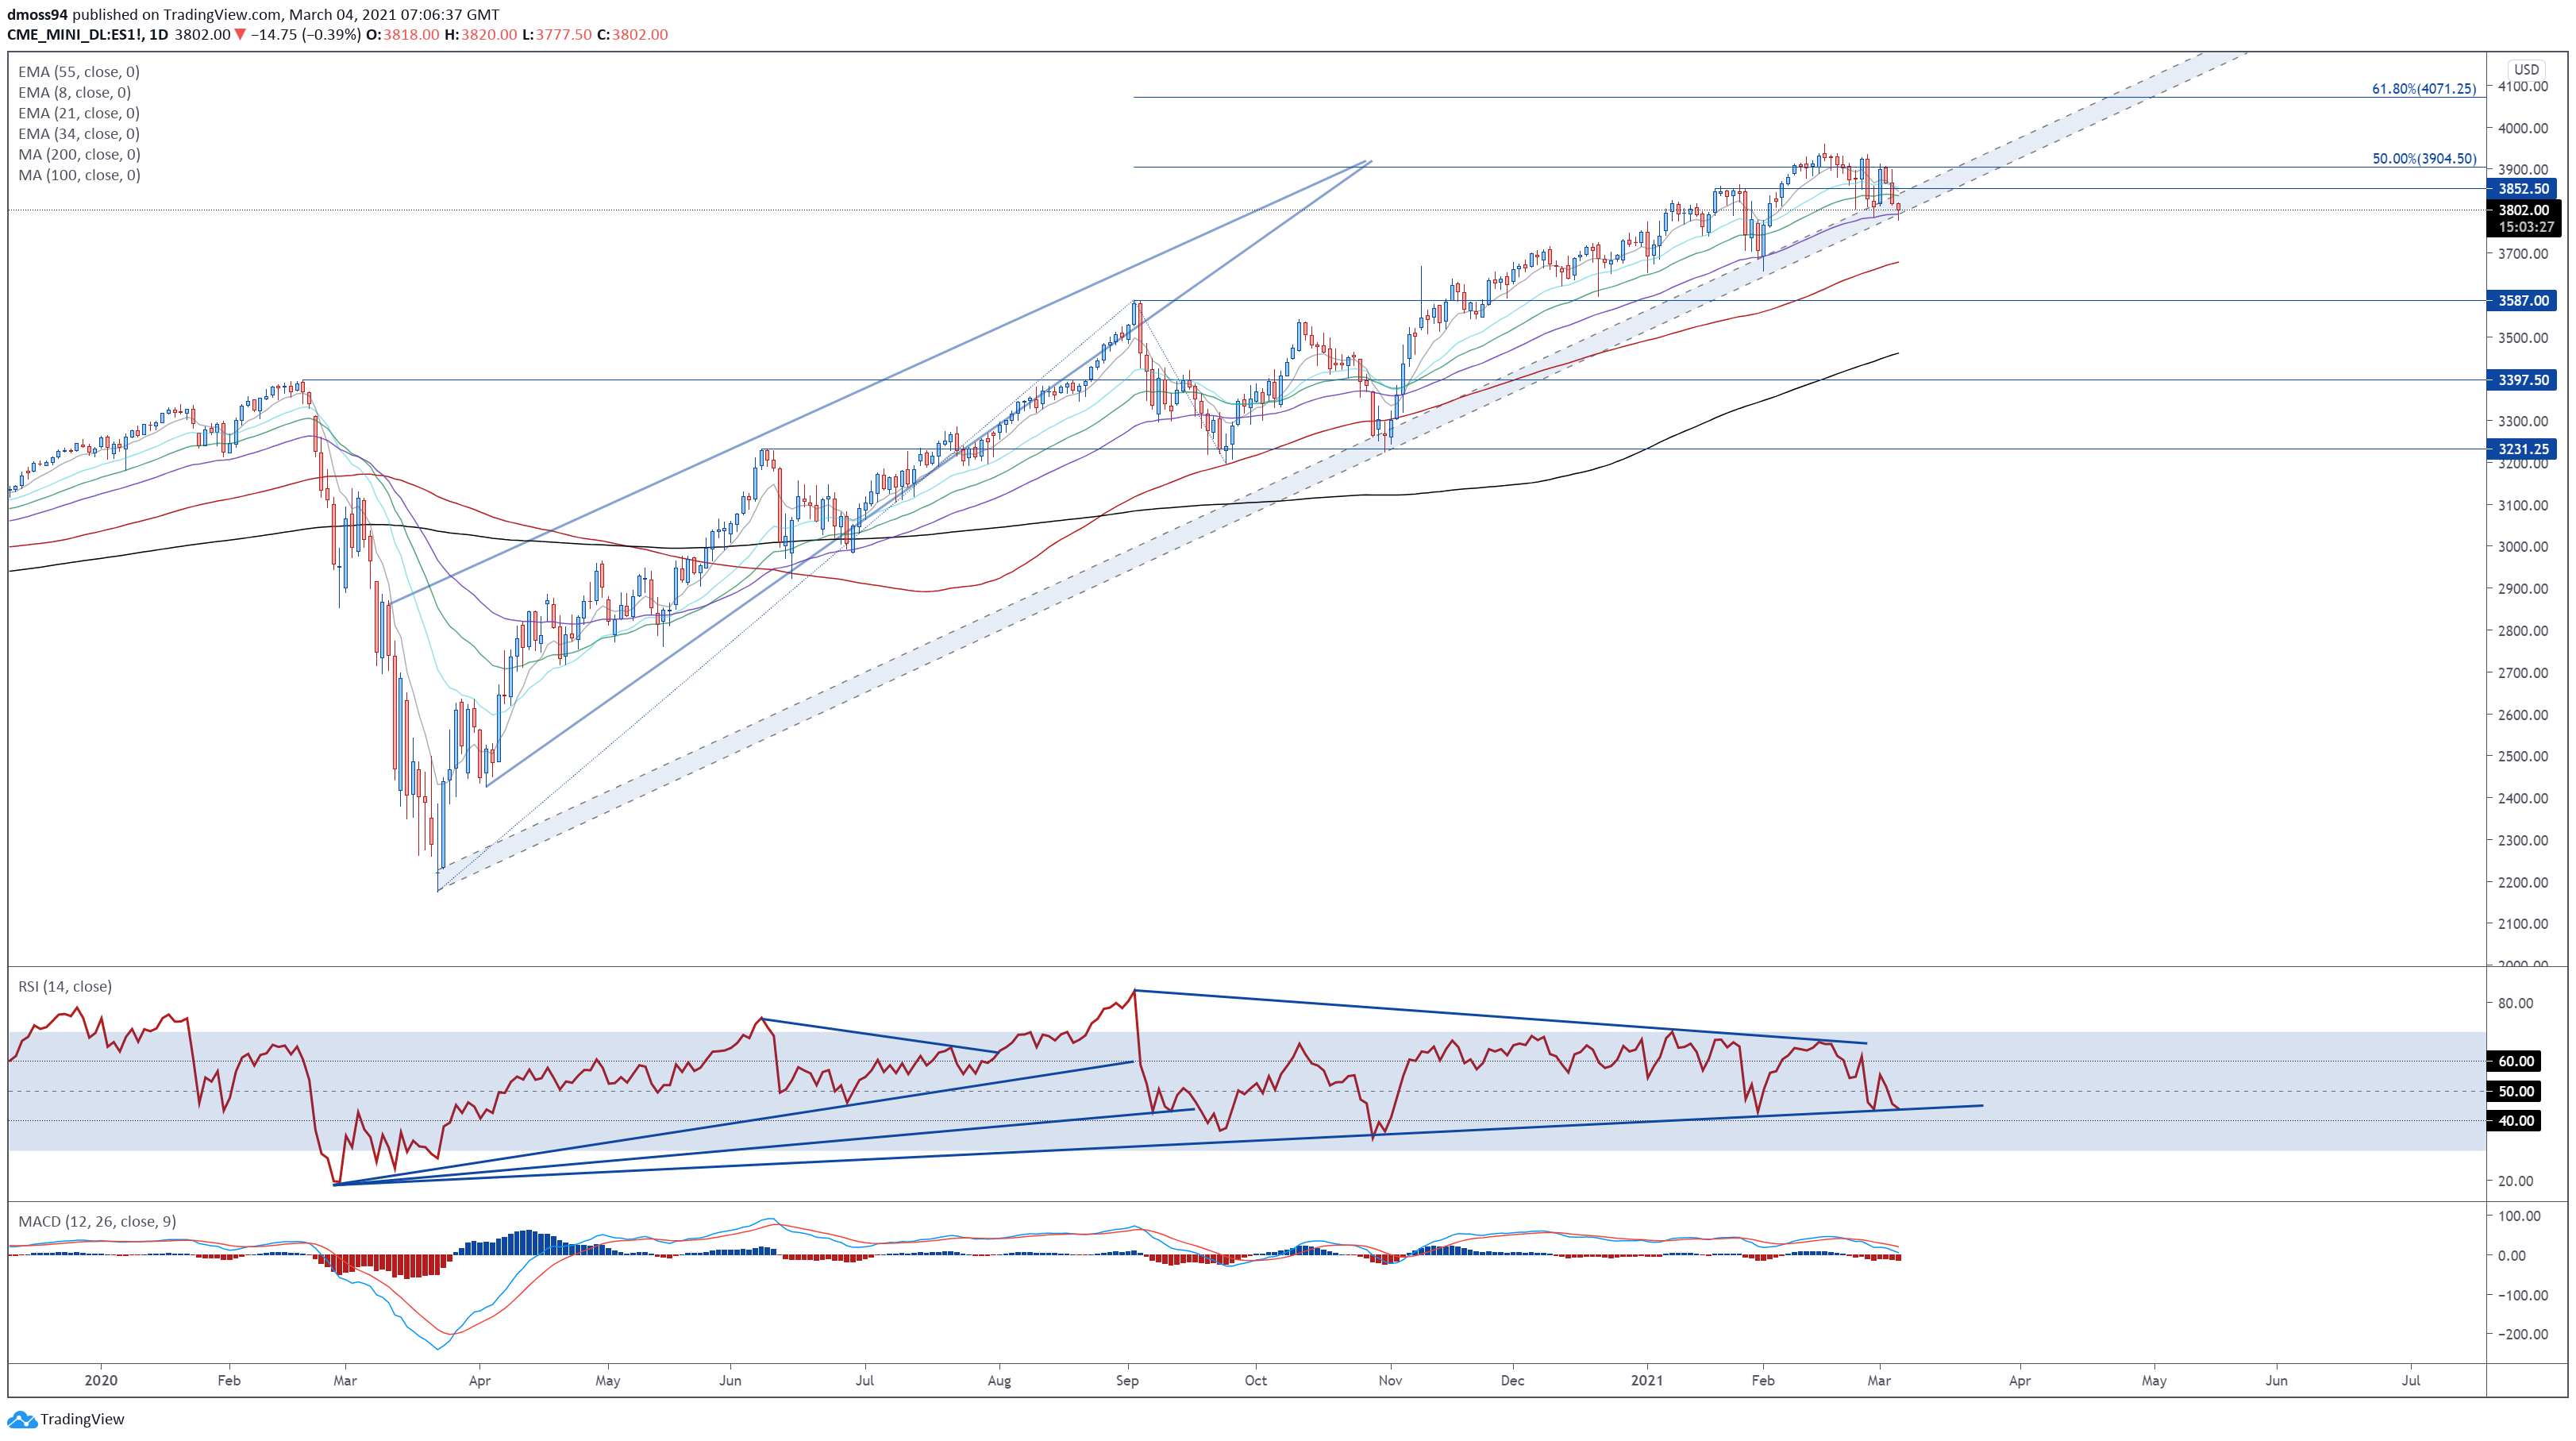
Dow Jones Futures Daily Chart – 1-Year Trend Support Remains Intact
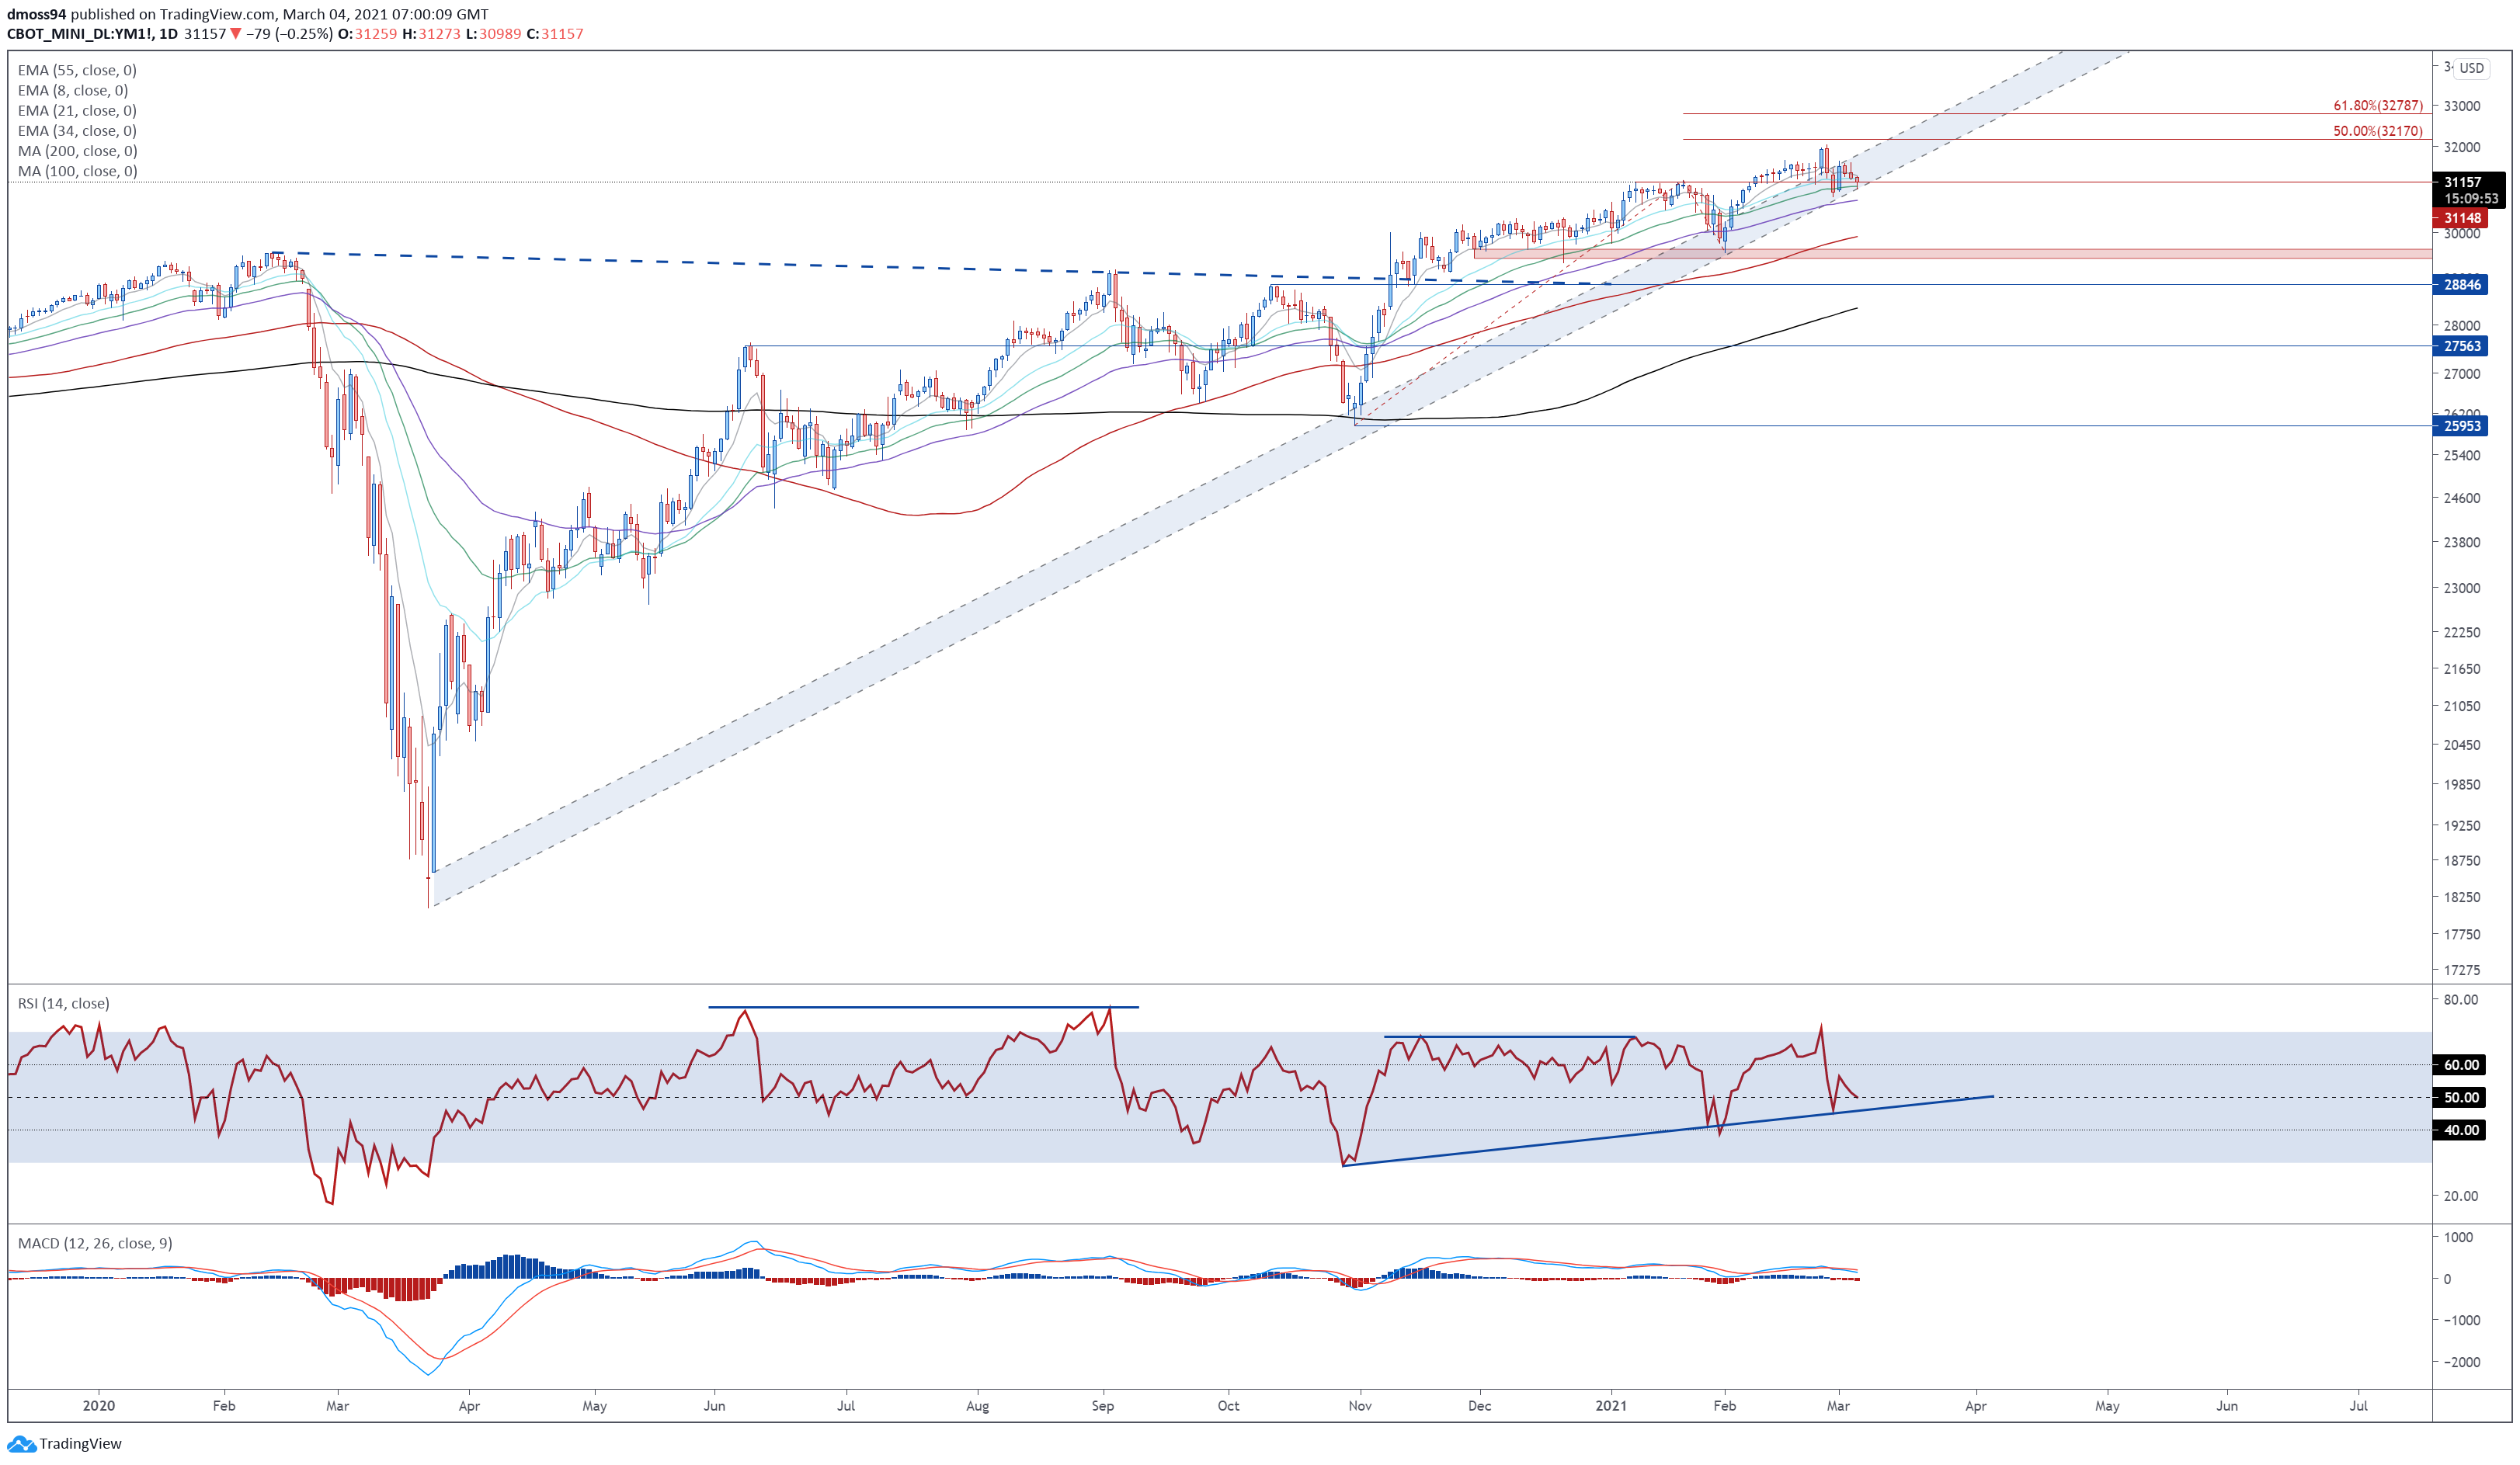
Dow Jones futures daily chart created using Tradingview
From a technical perspective, the outlook for the Dow Jones remains skewed to the topside, as price continues to track the uptrend extending from the March 2020 nadir.
With the index tracking firmly above the trend-defining 55-EMA (30732), and the RSI bouncing back above its neutral midpoint, the path of least resistance seems higher.
A daily close above the 8-EMA (31309) would probably neutralize near-term selling pressure and open the door for buyers to prob the yearly high (32033).
Conversely, a daily close below the February 26 low (30803) could generate a more extended correction lower and bring range support at 29450 – 29600 into focus.
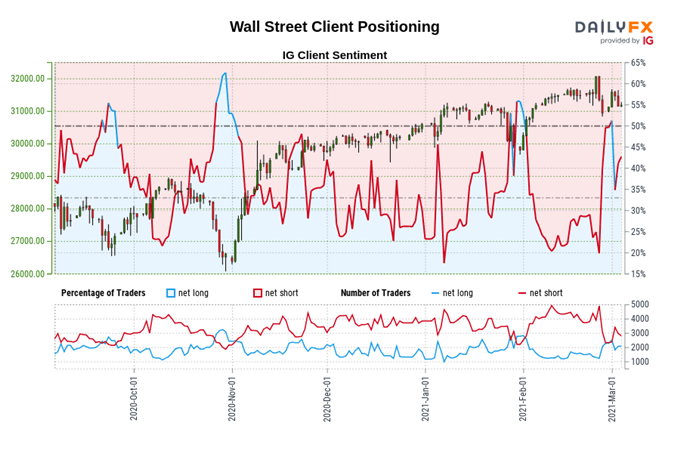
The IG Client Sentiment Report shows 42.81% of traders are net-long with the ratio of traders short to long at 1.34 to 1. The number of traders net-long is 3.67% higher than yesterday and 68.88% higher from last week, while the number of traders net-short is 6.22% lower than yesterday and 43.55% lower from last week.
We typically take a contrarian view to crowd sentiment, and the fact traders are net-short suggests Dow Jones prices may continue to rise.
Yet traders are less net-short than yesterday and compared with last week. Recent changes in sentiment warn that the current Dow Jones price trend may soon reverse lower despite the fact traders remain net-short.
S&P 500 Futures Daily Chart – 55-EMA Capping Downside….For Now
S&P 500 futures daily chart created using Tradingview
The technical outlook for the S&P 500 also remains relatively bullish, as price continues to track the uptrend extending from the March 2020 nadir.
With the index bouncing away from the 55-EMA (3792), and the RSI continuing to respect its uptrend extending from the March 2020 extremes, a rebound higher appears in the offing.
Holding above psychological support at 3800 probably opens the door for buyers to challenge the 3850 mark, with a convincing push above needed to bring the yearly high (3959) into the crosshairs.
However, a daily close below the 55-EMA (3792) could intensify selling pressure and drive the index back towards the 100-MA and February low (3656).
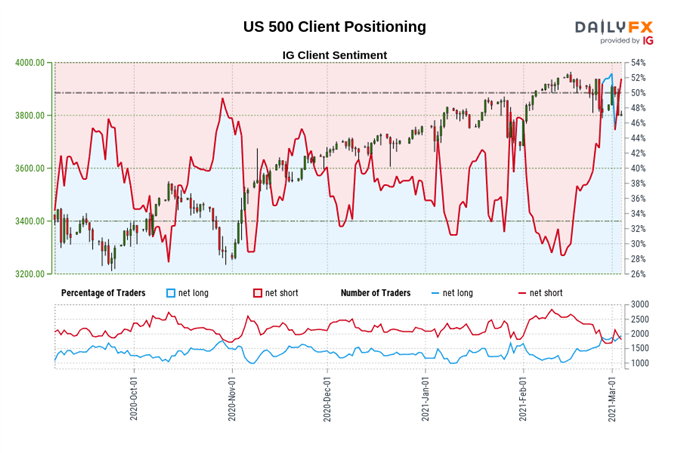
The IG Client Sentiment Report shows 53.75% of traders are net-long with the ratio of traders long to short at 1.16 to 1. The number of traders net-long is 9.09% higher than yesterday and 29.52% higher from last week, while the number of traders net-short is 10.34% lower than yesterday and 19.77% lower from last week.
We typically take a contrarian view to crowd sentiment, and the fact traders are net-long suggests S&P 500 prices may continue to fall.
Traders are further net-long than yesterday and last week, and the combination of current sentiment and recent changes gives us a stronger S&P 500-bearish contrarian trading bias.
-- Written by Daniel Moss, Analyst for DailyFX
Follow me on Twitter @DanielGMoss


