


CRUDE OIL & GOLD TALKING POINTS:
- Crude oil prices saw little lasting impact from upbeat US jobs data
- Technical cues point to ebbing upside momentum near $40/bbl mark
- Gold prices struggle at resistance, near-term uptrend held for now
Crude oil prices edged higher as risk appetite firmed across global financial markets Thursday, pulling the WTI benchmark upward alongside stocks. Upbeat US payrolls data stirred a bit of seesaw volatility but ultimately failed to contribute to directional momentum in a lasting way. Nevertheless, prices on pace to finish the week above the $40/bbl figure for the first time since early March.
Gold prices recorded a similar response. It spiked lower as better-than-expected jobs growth drove up yields – undermining the appeal of the non-interest-bearing metal – but managed to erase the drop within a mere two hours as borrowing costs backtracked. Acknowledgement of the Fed’s firmly dovish policy stance may have helped limit follow-through.
Looking ahead, observance of the Independence Day holiday in the US will shorten the trading day and pull down participation levels. That may translate into directionless drift in the final hours of the trading week. Thin liquidity conditions may amplify kneejerk volatility if a particularly eye-catching headline beckons a response however, though follow-through on any such move is inherently suspect.

CRUDE OIL TECHNICAL ANALYSIS
Crude oil prices continue to mark time below resistance in the 42.40-43.88 area. Negative RSI divergence points to fading upside momentum but it is unclear whether this speaks to a period of consolidation preceding upward resumption or the start of a downturn. A daily close below support at 34.78 may expose the 27.40-29.11 area. Alternatively, a breach of resistance eyes the $50/bbl figure next.
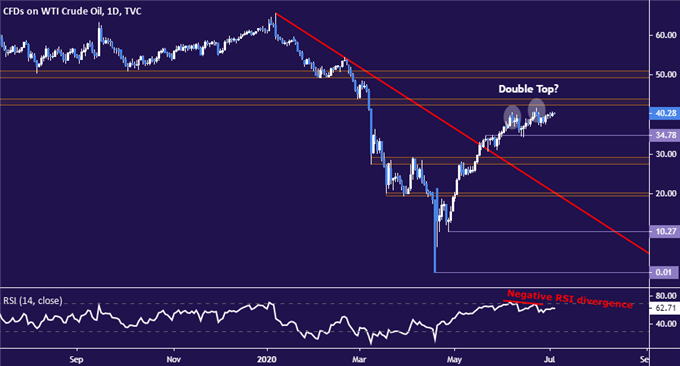
Crude oil price chart created using TradingView
GOLD TECHNICAL ANALYSIS
Gold prices are wedged between the 38.2% Fibonacci expansion at 1789.78 and range resistance-turned-support at 1747.74. A break upward seems to target the 50% level at 1827.82 next. Alternatively, a turn back through support probably sees the subsequent downside hurdle at 1679.81. Such a move would double as a break of the near-term uptrend, signaling the emergence of a bearish bias.
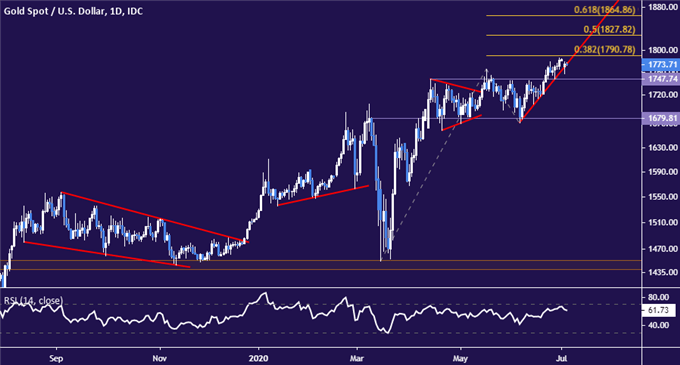
Gold price chart created using TradingView

COMMODITY TRADING RESOURCES
- See our free guide on the drivers of crude oil price trends
- What is your trading personality? Take our quiz to find out
- Join a free live webinar and have your questions answered
--- Written by Ilya Spivak, Head APAC Strategist for DailyFX
To contact Ilya, use the comments section below or @IlyaSpivak on Twitter


