


SILVER PRICE, GOLD – TALKING POINTS:
- Gold and silver are both frequently cited as having counter-riskproperties
- But silver’s demand profile is skewed much more toward industrial demand
- This sees it acting more like a cyclical asset than gold when times are tough
Silver prices have underperformed those of gold as the coronavirus has come to utterly dominate market sentiment.
While gold prices remain elevated, underpinned by that all-too-understandable haven bid, silver prices are well down for the year to date. Indeed, still nursing falls of around 16% they’re behaving rather more like risk-correlated equity than any sort of bet-hedging haven asset. Gold on the other hand is up by more than 10%.
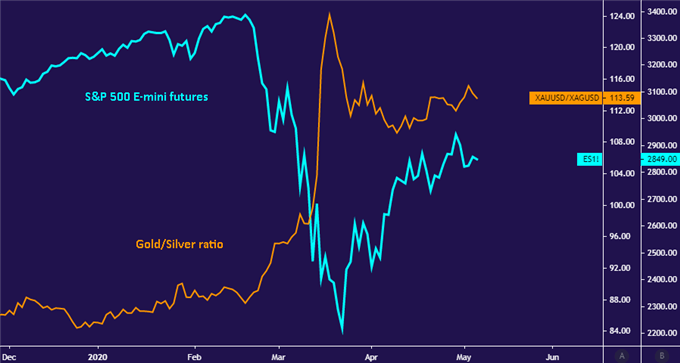
Chart created with TradingView
The reason behind this discrepancy is that, while both gold and silver are obviously precious metals, priced by the ounce rather than the tonne, their demand profiles are really very different.
Estimates of industrial demand for silver vary, but they coalesce around the 50% level. Aside from its coveted beauty, silver is the best thermal and electrical conductor of all elemental metals. Meanwhile gold is much more obviously a financial asset, with industrial use accounting for barely 10% of buyers. It has its industrial uses too, of course, but it’s expensive and that tends to limit them.
What that means is that silver is far more vulnerable than gold to the prospect of a global recession. When growth collapses, so does that industrial demand. Some of it will no doubt be replaced by increased buying from the haven-seeking community, but far from all.
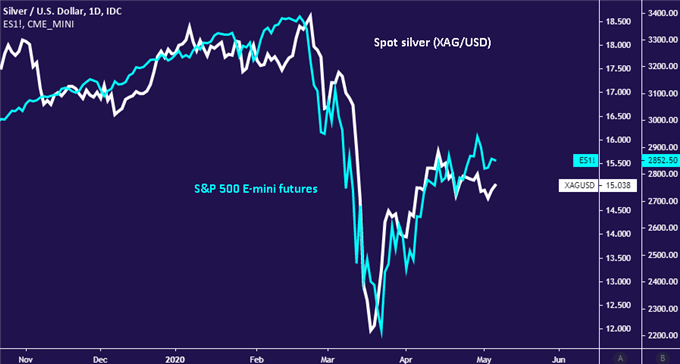
Chart created with TradingView
It is notable however, that the gold/silver ratio is now extremely stretched. That number is simply the number of ounces of silver it takes to match the price of a single ounce of gold. At current levels it’s around 114. The ratio has in fact been rising steadily since the mid-1960s, but was generally below 80 between 1990 and 2018. It tends to blow out during periods of rising economic uncertainty. The current period certainly fits that bill.
The ratio seems likely to snap back quite sharply if national economies manage to re-open and operate without a Covid re-emergence. However, investors should probably bear in mind the overall rising trend here.
| Change in | Longs | Shorts | OI |
| Daily | -2% | -3% | -3% |
| Weekly | 1% | -20% | -4% |
Silver Resources for Traders
Whether you’re new to trading or an old hand DailyFX has plenty of resources to help you. There’s our trading sentiment indicator which shows you live how IG clients are positioned right now. We also hold educational and analytical webinars and offer trading guides, with one specifically aimed at those new to foreign exchange markets. There’s also a Bitcoin guide. Be sure to make the most of them all. They were written by our seasoned trading experts and they’re all free.
--- Written by David Cottle, DailyFX Research
Follow David on Twitter @DavidCottleFX or use the Comments section below to get in touch!


