


Talking Points
-Risk appetite gets fed through event risk this week…will the food be good or distasteful?
-Higher probability patterns suggest continued strength
-Pattern remains bullish while prices are above 18,000
Now that Black Friday is behind us are there other ‘deals’ to find in Dow Jones Industrial Average (DJIA)?
This Wednesday November 30, OPEC has a scheduled meeting to discuss supply management. Previously, there had been talk on production cuts. As late as Friday, negotiations were breaking down due to internal struggles.
The outcome of a Wednesday meeting may affect global risk appetite which could impact equity markets like DJIA.
On Friday, we have the United States jobs report. This is seen as a thermometer to the health of the US economy. Currently, economists are expecting 175k new jobs added with the unemployment rate holding steady at 4.9%. A large deviation from these figures could jolt DJIA price.
The rest of this article will be technical in nature. If you wish to read our Q4 outlook for equities, grab a copy here.
Or, if you wish to join Jeremy in his Monday 9;30a ET US Opening Bell webinars to discuss this market, register and join here.
Looking into the technical picture, there is cause to pause that prices may experience some dips this week.
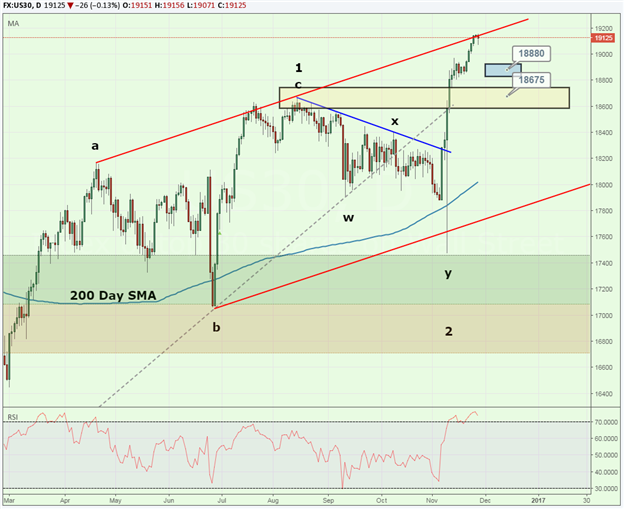
First of all, a trend line connecting the April and August 2016 highs crosses near current levels. The market has thought this line was important in the past so it might provide a barrier or resistance moving forward.
Any ‘sale’ or dips in prices likely work down towards previous congestion and swing highs. The first level comes into play near 18,880. A secondary level of potential support is near 18,675 which represents the August 15 high.
Though not expected, if prices push below 18,000, then a bigger correction is taking place. So long as prices are above 18,000, look to guy a dip.
Dow Jones Industrial Daily Chart
Created using TradingView
---Written by Jeremy Wagner, Head Trading Instructor, DailyFX EDU
Follow me on Twitter at @JWagnerFXTrader .
See Jeremy’s recent articles at his Bio Page.
To receive additional articles from Jeremy via email, join Jeremy’s distribution list.


