


Talking Points
- USD/JPY Consolidates After Tuesday’s 176 Pip Decline
- Daily USD/JPY Support is Found at 99.53
- What’s next for the USD/JPY and US Dollar Pairs? Learn more with our Trading Guide
The USD/JPY continues to consolidate for the second consecutive day, after prices dramatically dropped 176 pips in Tuesdays trading. With the USD/JPY failing to breakout, the currency pair still remains inside of Tuesday’s daily high and low. This places Tuesdays high of 101.29 as a point of resistance, and the low of 99.53 as support. As such, traders should continue to monitor these values and plan for the markets next major breakout.
USD/JPY, Daily Chart & Inside Bar Consolidation
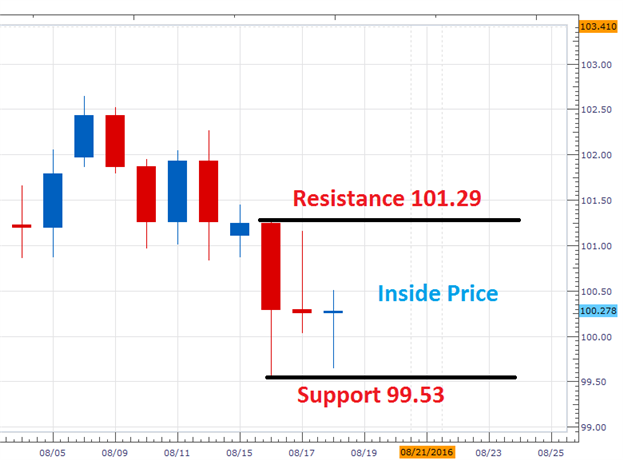
Chart prepared by Walker England
In the 10 minute graph below, we can see the USD/JPY rebounding from its daily low of 99.64. Despite this rally, the Grid Sight Index (GSI) is currently highlighting a short term downtrend in the last hour of trading. After reviewing 32,791,476 pricing points, GSI has declined 21 pips or more in 48% of the 21 identified historical matching events. This places today’s first bearish distribution at a price of 99.98. If the USD/JPY moves back below this value, traders may look for the pair to potentially challenge daily lows and longer term support at 99.53
Alternatively, GSI has indicated that prices have advanced 20 pips or more in 38% of the 21 matching events. This places the first bullish distribution at a price of 100.39. It should be noted that the final bullish distribution identified by GSI is found at 100.99. In only 10% of the matching historical evens did prices rise by at least 80 pips Even if the USD/JPY did reach this value, it would still be trading below range resistance at 101.29.
How can GSI help in your trading? Get started learning about the Index HERE.

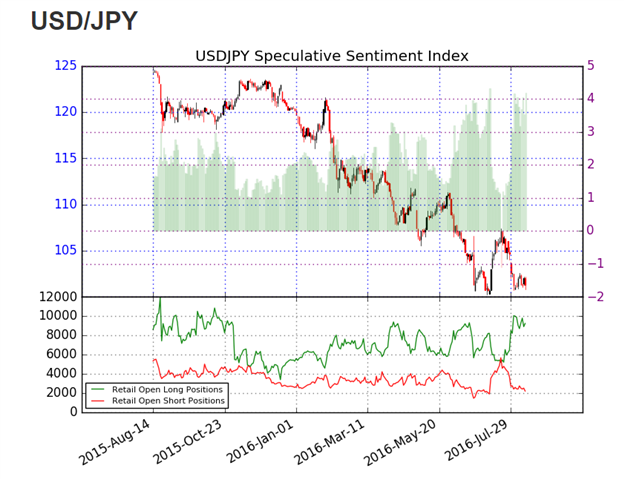
Sentiment for the USD/JPY remains extreme, with SSI (speculative sentiment index) reading at +4.18. With 81% of positioning long, SSI suggests that the USD/JPY may decline further. In the event of a bearish breakout, it would be expected for positive sentiment reading to remain extreme. Alternatively, if prices revers higher, SSI may decline towards a more neutral reading.
Are traders long or short the market Find out here !
To Receive Walkers’ analysis directly via email, please SIGN UP HERE
See Walker’s most recent articles at his Bio Page.
Contact and Follow Walker on Twitter @WEnglandFX.


