


Talking Points
- AUD/USD Approaches Range Resistance at .7517
- Support is Found at AUD/USD Weekly Lows Near .7452
- If you are looking for more trading for US Dollar check out our Trading Guides
The AUD/USD continues to consolidate today, after moving to new weekly lows late in Wednesdays trading. The weekly low for the AUD/USD currently resides at .7452, and this value comprises a key point of support for an ongoing trading range. Resistance has been noted in the graph below as the last swing high for July 19, found at a price of .757. As prices continue to range traders should continue to track short-term momentum, coupled with support and resistance, to pinpoint any future breakouts in price.
AUD/USD, 1 Hour Chart

(Created by Walker England)
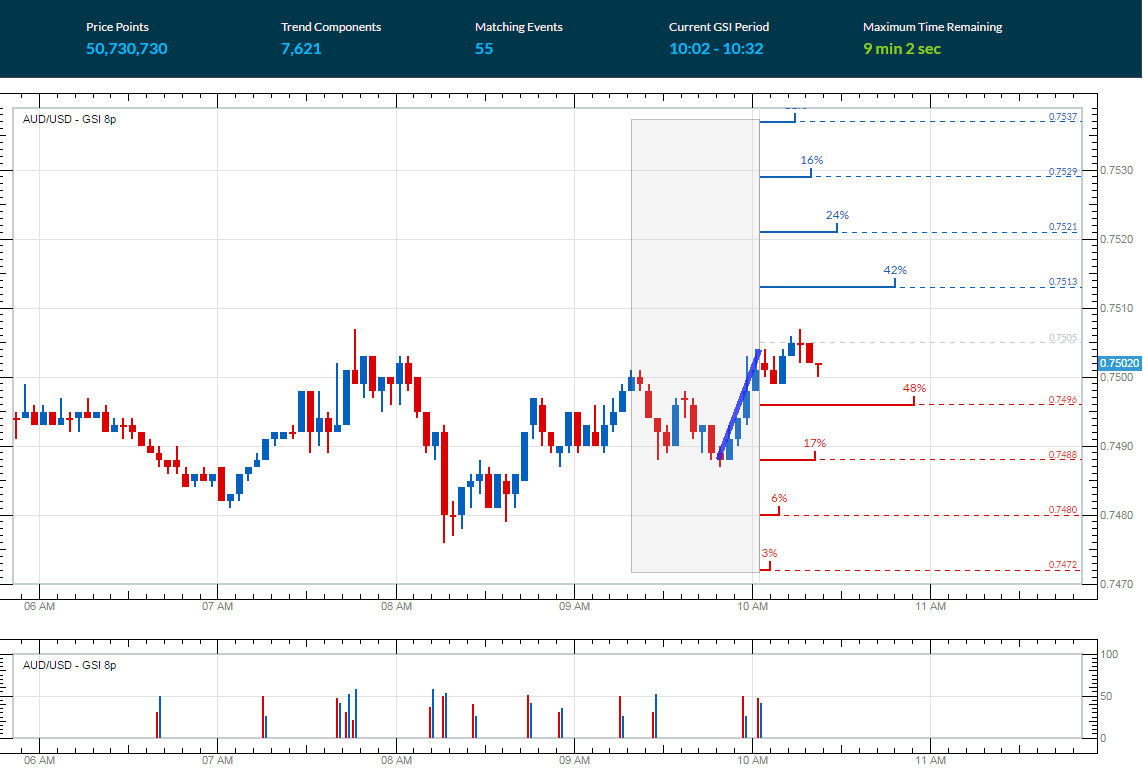
In the graph below, we can see the AUD/USD moving on range resistance after a short-term uptrend. The Grid Sight Index has identified this short-term move higher by pinpointing a series of higher highs on the 3-minute chart. After considering 50,730,730 pricing points, GSI has also indicated that price action has advanced a minimum of eight pips in 42% of the 55 matching historical events. This places today’s first historical price distribution at .7513. A move to this point would be significant, as it would open the AUD/USD to breakout from the previously mentioned trading range.
Alternatively, traders may look for a retracement in price if price begin to turn back towards range support. The Grid Sight Index found prices declined 9 pips in 48% of the reviewed historical matches. A move through the first bearish distribution, found at .7496, would open the pair for further declines. It should be noted that prices only fell 33 pips, in only 3% of historical instances. This places today’s final bearish distribution at a price of .7472.
Want to learn more about GSI? Get started learning about the Index HERE.
AUD/USD 3 Minute GSI Chart
SSI for the AUD/USD is currently reading at +1.06. While 51% of positioning long, this neutral SSI reading is indicative of the current consolidating market. If the AUD/USD breaks lower, traders should look for SSI to read positive, and move towards an extreme of +2.0 or more. Alternatively, if the AUD/USD breaks above support, SSI may flip back to a negative reading.

To Receive Walkers’ analysis directly via email, please SIGN UP HERE
See Walker’s most recent articles at his Bio Page.
Contact and Follow Walker on Twitter @WEnglandFX.


