


Talking Points
- AUD/USD Finds Support at a 61.8% Fibonacci Retracement
- Bearish Breakouts Open Up a Potential Decline towards .7108
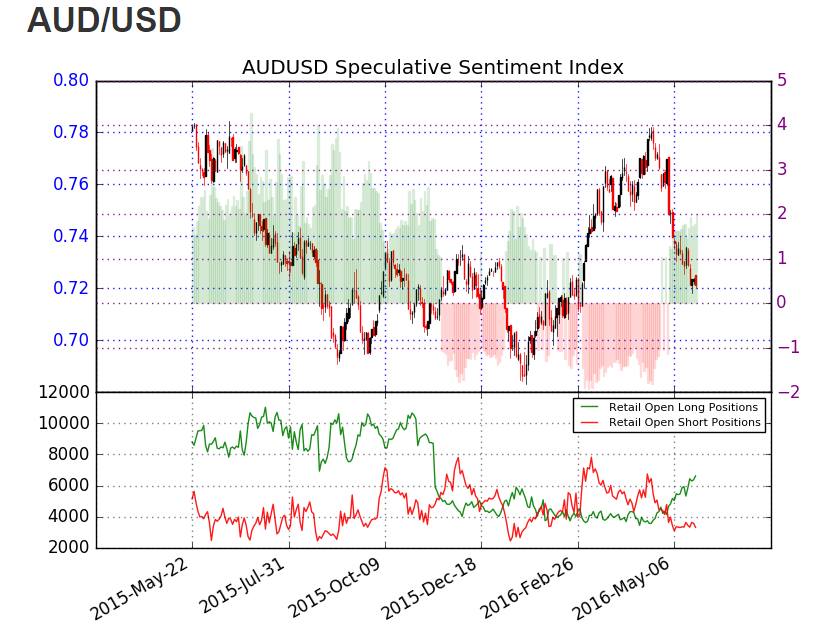
- Sentiment Remains Extreme, with SSI Reading +2.03
The AUD/USD continues to test price support this morning, as May’s downtrend is poised to continue. Current price support can be seen below comprised of a 61.8% Fibonacci retracement. This Fib line is found at .72121 and has been identified by measuring the distance between the standing 2016 low at .6827 and the April high found at .7835. Currently price action is trading under this Fib level, which opens the AUD/USD to test other values of support. This includes the psychological .7200 value, and the current May low found at .7176.
AUD/USD Daily Chart
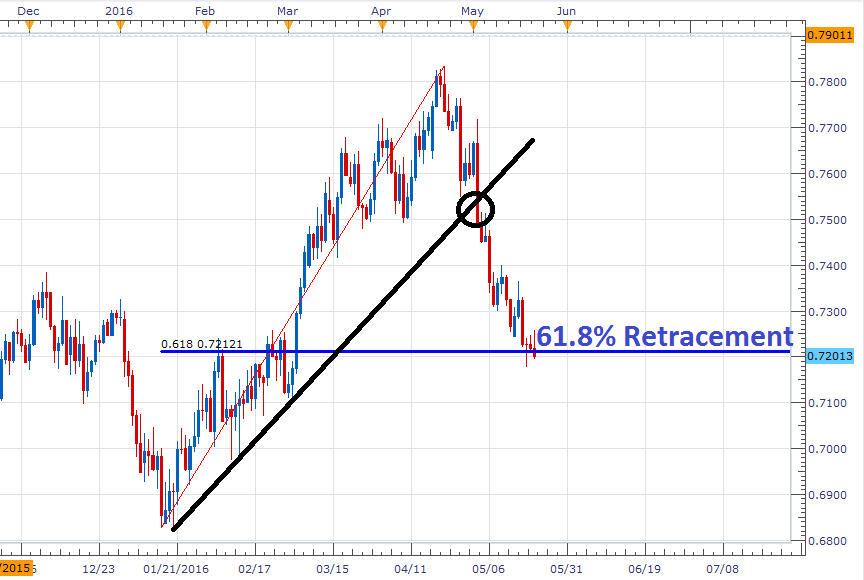
(Created using Marketscope 2.0 Charts)
In the event of a breakdown of support, AUD/USD traders may begin targeting the next values of support. This includes the March 2016 low at .7108, as well as .7042, which is found at the 78.6% Fibonacci retracement level. In the event that price remains supported, traders may begin to look for a reversal in the pair. In this scenario, traders may look for prices to rally and potentially challenge the current 2016 high.
See real time shifts in market sentiment. Find out more at the DailyFX’s sentiment page.
Sentiment for the AUD/USD reads at an extreme SSI (speculative sentiment index) value of +2.03. With the majority of open interest long, it suggests that there may be a further decline in price for the pair. If prices do find support at current levels, traders should monitor SSI. A reversal in price towards higher highs would potentially shift SSI towards more neutral values, or shift the index negative.
To Receive Walkers’ analysis directly via email, please SIGN UP HERE
See Walker’s most recent articles at his Bio Page.
Contact and Follow Walker on Twitter @WEnglandFX.


