


Interested In our Analyst’s Longer-Term Oil Outlook, be sure to sign up for our free oil guide here.
Talking Points:
- Crude Oil Technical Strategy: Oil Watching Key Resistance At $32bbl
- Intermarket Analysis Turns Focus of Price Support On US Dollar Heaviness
- WTI printed at 12-yr low of $27.53/bbl yesterday and shows no signs of abating
Crude Oil seemed to have the same sentiment as EURUSD did in early 2015 where traders were taken as an amateur if they did not believe EURUSD would print below 1.0000. A year later, it still has not.
Now, with Crude Oil, no price target seems to be bearish enough, and as long as your target was lower, it was likely to be hit. Today, a fundamental shift has been announced in the Oil market by Saudi Aramco’s CEO in Davos at a time that price has hit technical support on an extreme move. By extreme, I mean that WTI Crude was lower by 28% YTD on the 20th of the first month.
Fundamentally, a key story came when the Aramco CEO noted that Saudi Arabia would be letting the Oil market balance supply and demand. In other words, production may slow so that the market could catch from the air and not drown in oversupply.
To receive Tyler’s analysis directly via email, please SIGN UP HERE
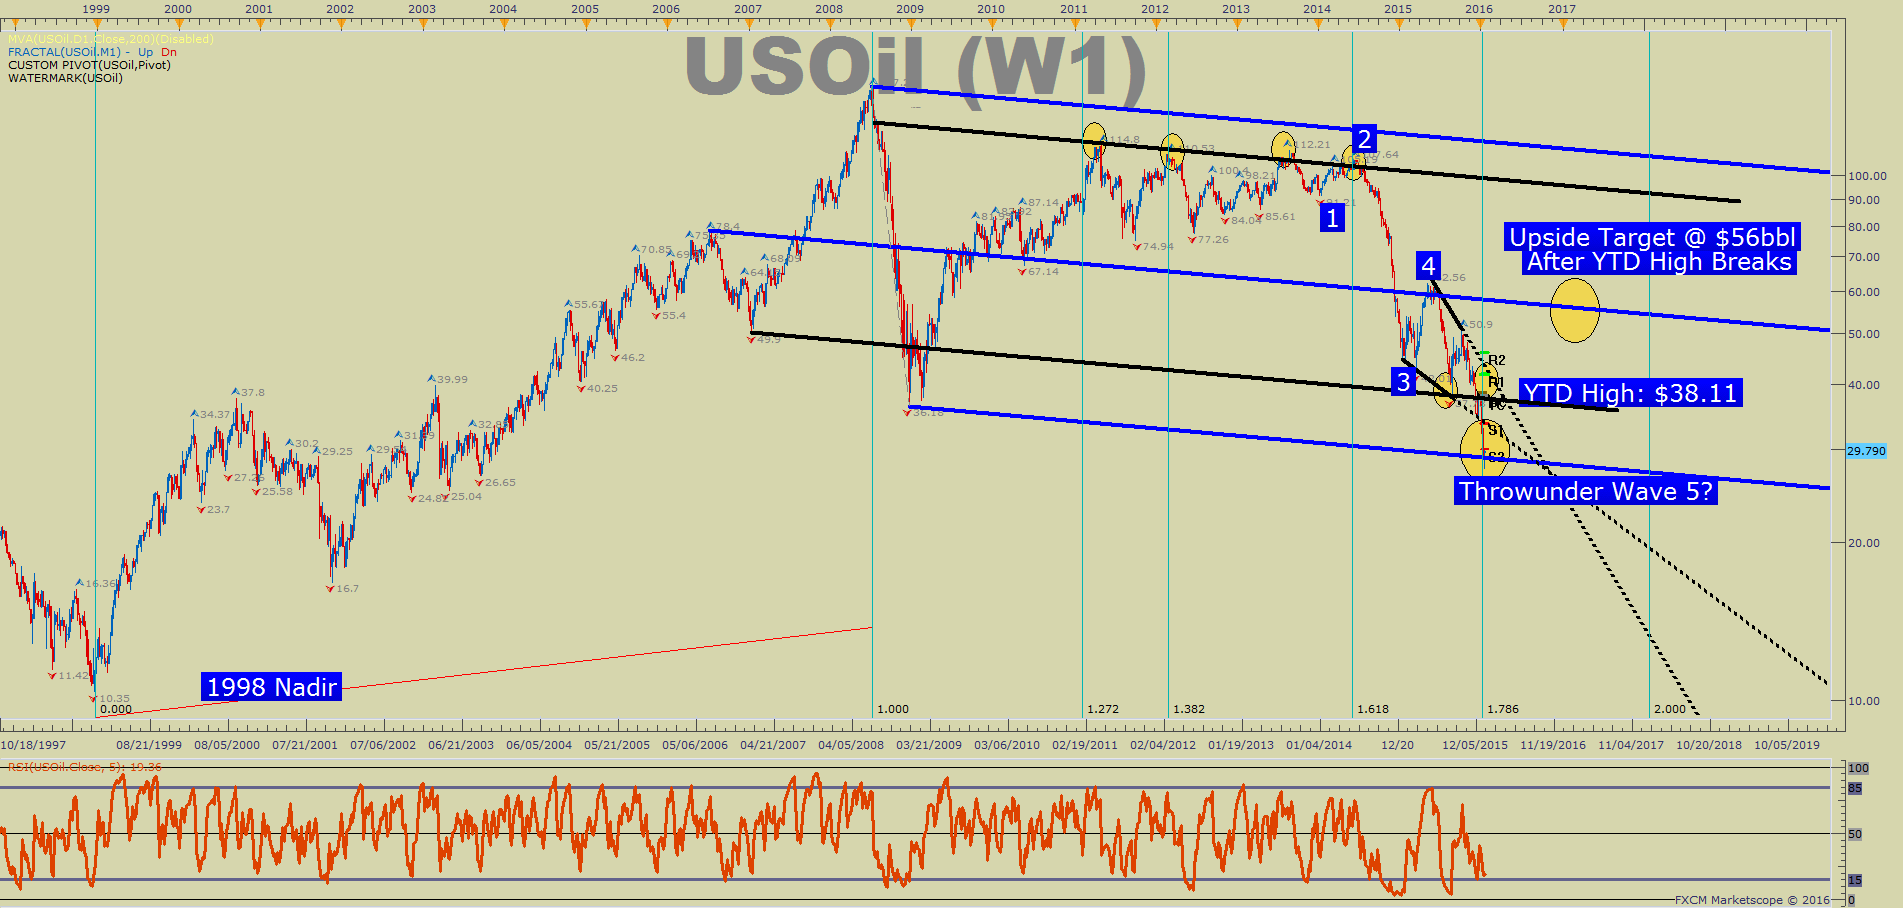
Yesterday, we noted that $32 per barrel was a key level of resistance. That still holds true, but with the Saudi Aramco news and the long-term chart support aligning, there is now a reason to watch for a persistence bid to take Oil to $32 per barrel. Should the $32 per barrel level be taken out, attention will then turn to the YTD high of $38.11 before getting overly bearish.
Oil still has a lot of pressure on its back, and may continue to fall even lower, which aligns with our Speculative Sentiment Index or SSI. Our internal readings of Oil are showing an SSI reading of +1.896. We use our SSI as a contrarian indicator to price action, and the fact that the majority of traders are bullish provides a signal that US Oil may continue lower. If the reading were to turn negative, and price broke above resistance, we could begin looking for further upside toward the YTD high of $38.11.
T.Y.
To Learn What FXCM’s Most Successful Traders Do on a Consistent Basis, sign up for our free guide here.


