


To receive Ilya's analysis directly via email, please SIGN UP HERE
Talking Points:
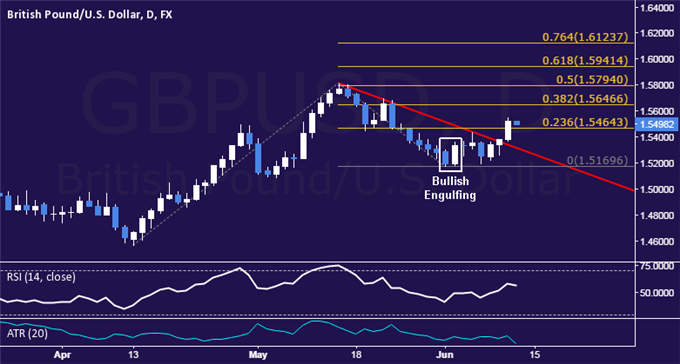
- GBP/USD Technical Strategy: Flat
- Support: 1.5464, 1.5311, 1.5170
- Resistance: 1.5647, 1.5794, 1.5941
The British Pound advanced against the US Dollar as expected after putting in a Bullish Engulfing candlestick pattern. Near-term resistance is at 1.5647, the38.2% Fibonacci expansion, with a break above that on a daily closing basis exposing the 50% level at 1.5794. Alternatively, a reversal below the 23.6% Fib at 1.5464 clears the way for a test of trend line resistance-turned-support at 1.5311.
While entering long seems compelling from a purely technical perspective, we will tactically opt against the trade. Our long-term outlook favors Pound weakness against the US Dollar as the Fed leads the BOE in normalizing monetary policy. With that in mind, we will treat any on-coming gains as corrective and look for a selling opportunity. In the meantime, we remain flat.
Add these technical levels directly to your charts with our Support/Resistance Wizard app!
--- Written by Ilya Spivak, Currency Strategist for DailyFX.com


