


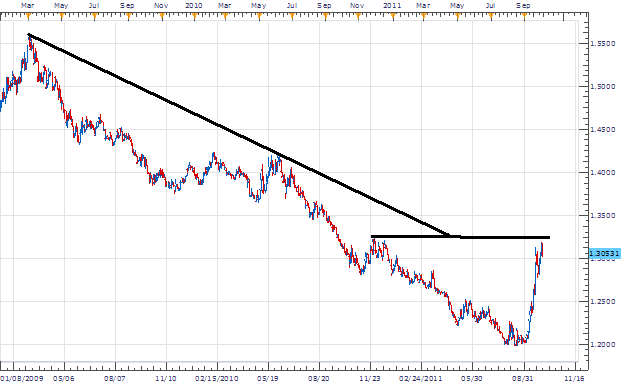
The USD/SGD has been one of the strongest market trends. The pair has steadily made lower lows dating back to the March 2010 high at 1.557. Recently the pair has reversed. Since July 2011 the pair retraces 1208 pips from its low of 1.1988 up to the October 4th high of 1.3196. This move against the trend offers traders a chance to rejoin the broader daily trend and potentially swing the pair back with a selling bias.
Fundamentally, the USD remains weak. Unemployment is still residing at 9.1%, with most market participants predicting the rate to not to change for Friday news event. Expectations can be found updated on the DailyFX economic calendar. As this news week unfolds we will look for chances to enter in the market with our daily trend.
Taking Price in to an 8HR chart we see divergence forming on the USD/SGD. Divergence can be seen by noting the USD/SGD created a higher on October 3rd. The MACD (Moving Average Convergence Divergence) Indicator has created a lower low during the same time frame. Traditional divergence, as represented by a separation of price and an indicator, is a tool utilized by swing traders looking to find a top / bottom after a period of price volatility.

My preference is to sell the USD/SGD in the direction with our broader daily trend with entry’s placed under 1.3000. Stops should be placed over resistance at 1.3250. Limits should be placed at 1.2500 for a clear 1:2 risk reward ratio. A second target may be placed at the 200 MVA on our 8Hour chart near 1.2290.
Alternative scenarios include price breaking through resistance found from the December 2010 high.
Additional Resources
Walker England contributes to the Instructor Trading Tips articles .To receive more timely notifications on his reports, email instructor@dailyfx.com to be added to the distribution list.


