US Dollar Vs Euro, British Pound, Japanese Yen – Outlook:
- USD is holding last week’s gains ahead of the Fed rate decision.
- What are the potential policy and trend scenarios for USD?
- What is the outlook and the key levels to watch for EUR/USD, GBP/USD, and USD/JPY?

The US dollar has rebounded slightly against its peers ahead of the key US Federal Reserve interest rate decision later Wednesday. What are the potential scenarios, both in terms of policy and technical charts?
Given that inflation continues to be well above the Fed’s target with the disinflation process slow at best, and the labour market remains resilient, a rate hike later Wednesday appears to be a done deal. The key question would bewhetherrate hikes happen after today’s meeting and byhow much. In this regard, the Fed statement and Powell’s comments will be key.
Robust demand and easing financial conditions could provide a justification for a reiteration/ continuation of the June policy rate projections (two more rate hikes before the year-end), which would be a hawkish tilt, boosting USD.
On the other hand, if the emphasis shifts to moderating price pressures, notably the sharp drop in core inflation in June, and being more patient while the disinflation process continues, it could be a strong signal of a skip at the September meeting. This could have bearish implications for the USD. Rate futures are pricing in a small possibility of one more rate hike sometime in September / November (after today’s), according to the CME FedWatch tool.
EUR/USD Weekly Chart
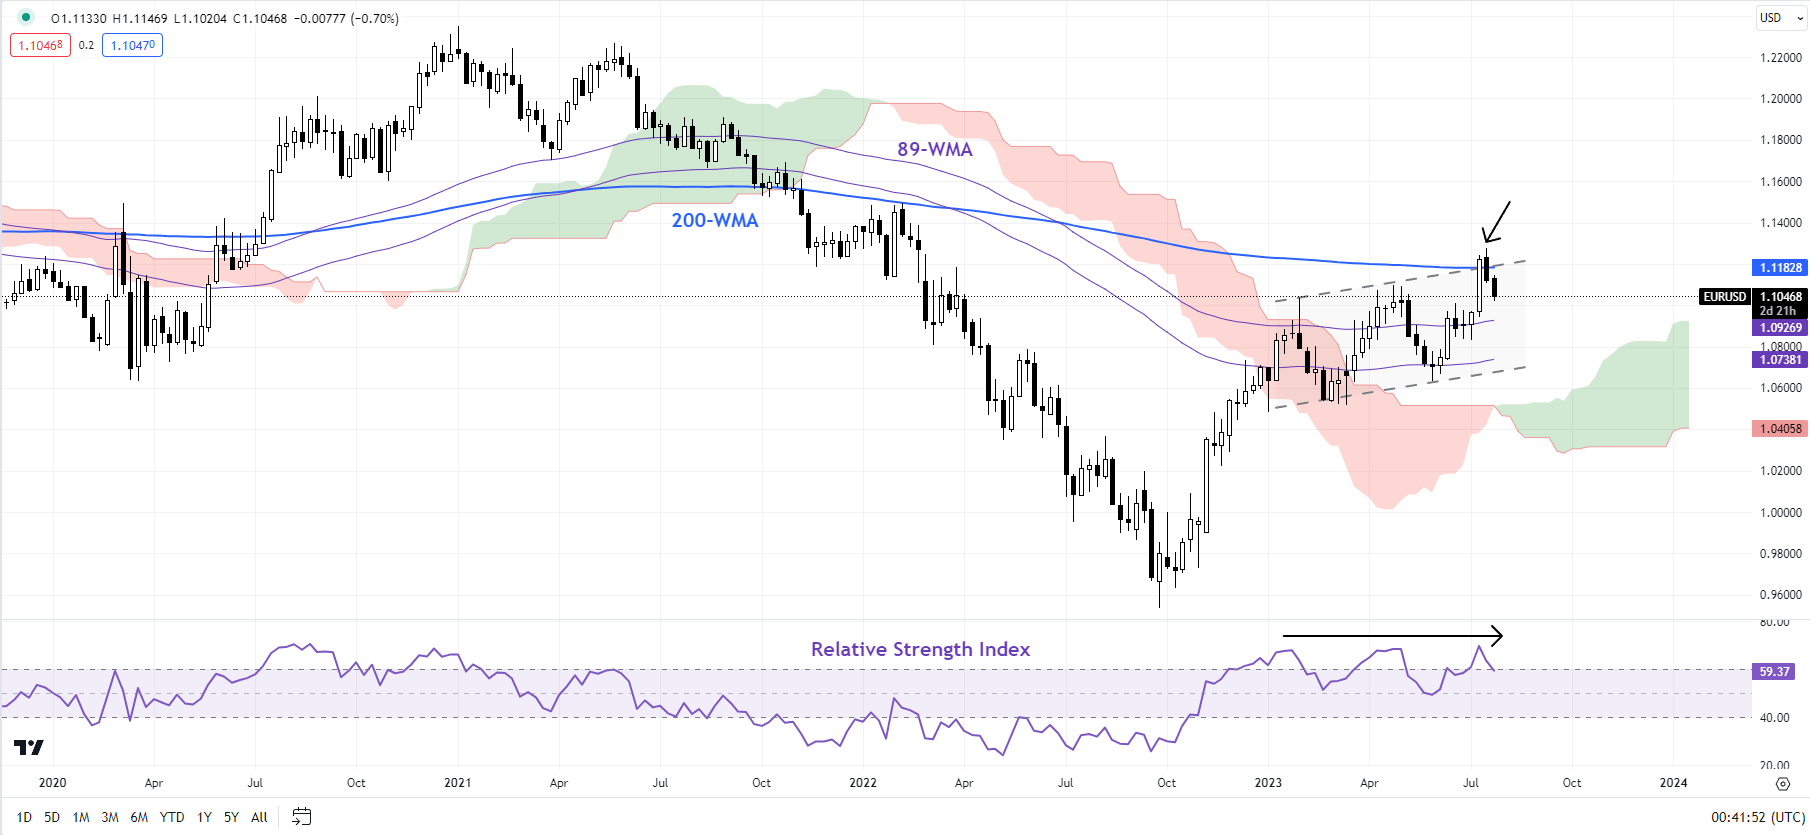
Chart Created by Manish Jaradi Using TradingView
EUR/USD: Rally stalls at a vital ceiling
EUR/USD’s rally has stalled at a vital converged ceiling, including the 200-week moving average (WMA) and the upper edge of a rising channel from early 2023. While the rise to a multi-month high coupled with the 14-week Relative Strength Index consistently above 50 in H1 bodes well for the constructive medium-term outlook, EUR/USD appears to be consolidating a bit further before embarking on a new leg higher.
EUR/USD 240-minute Chart
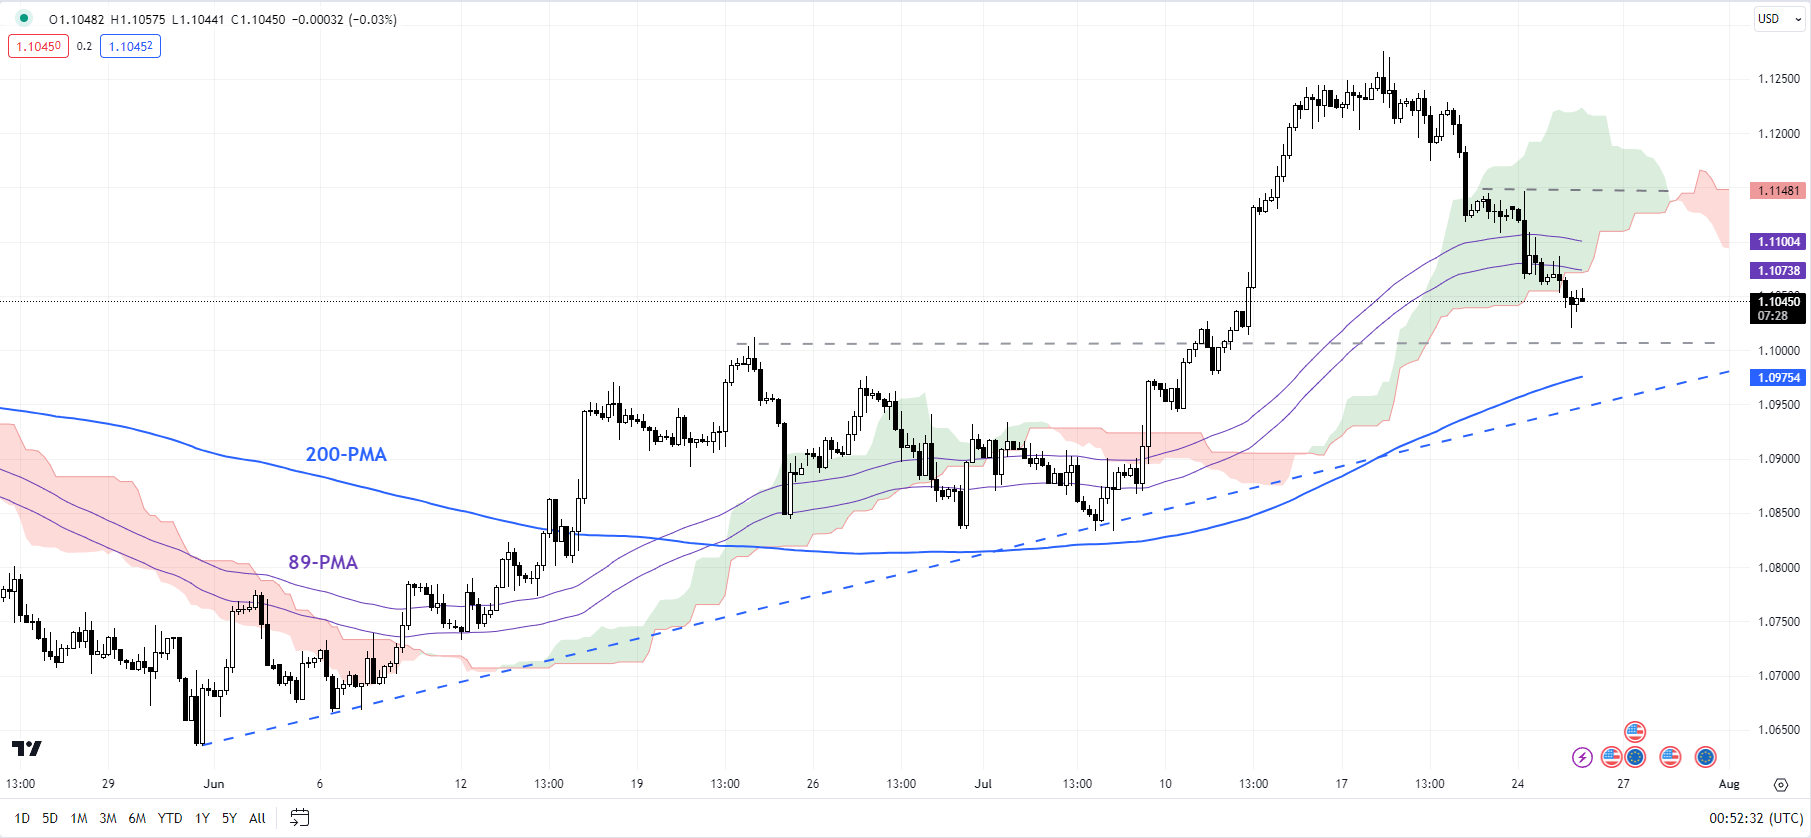
Chart Created by Manish Jaradi Using TradingView
The upward pressure has faded somewhat after EUR/USD’s fall below the 89-period moving average (PMA) on the 240-minute charts. Still, the pair remains above an uptrend line from early June, near the 200-PMA on the 4-hour chart. For the broader upward pressure to fade, EUR/USD would need to fall below the mid-July lows of 1.0825. On the upside, immediate resistance is at Monday’s high of 1.1150 followed by a stronger barrier at this month’s high of 1.1275.
GBP/USD Weekly Chart
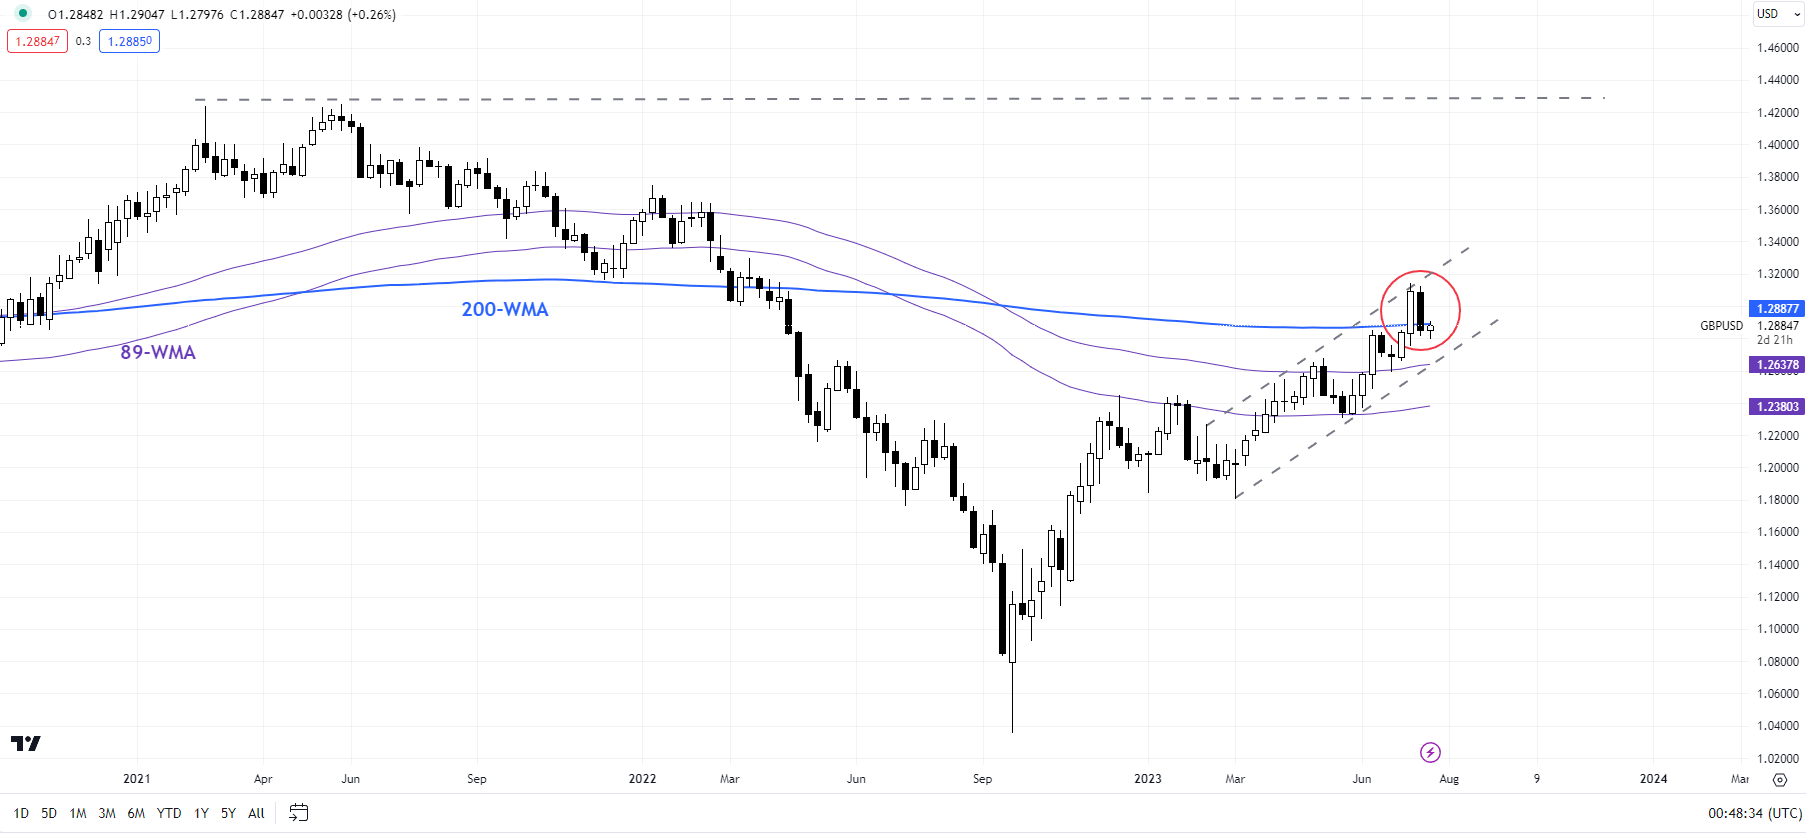
Chart Created by Manish Jaradi Using TradingView
GBPUSD: Flirts with a long-term hurdle
GBP/USD is flirting with a similar barrier on the 200-WMA, coinciding with the upper edge of a rising channel from early 2023. This follows the triggering of a major reverse head & shoulders pattern – the left shoulder is at the July 2022 low, the head is at the September 2022 low, and the right shoulder is at the Q1-2023 low – pointing to a move toward the 2021 high of 1.4250 in coming months.
GBP/USD 240-minute Chart
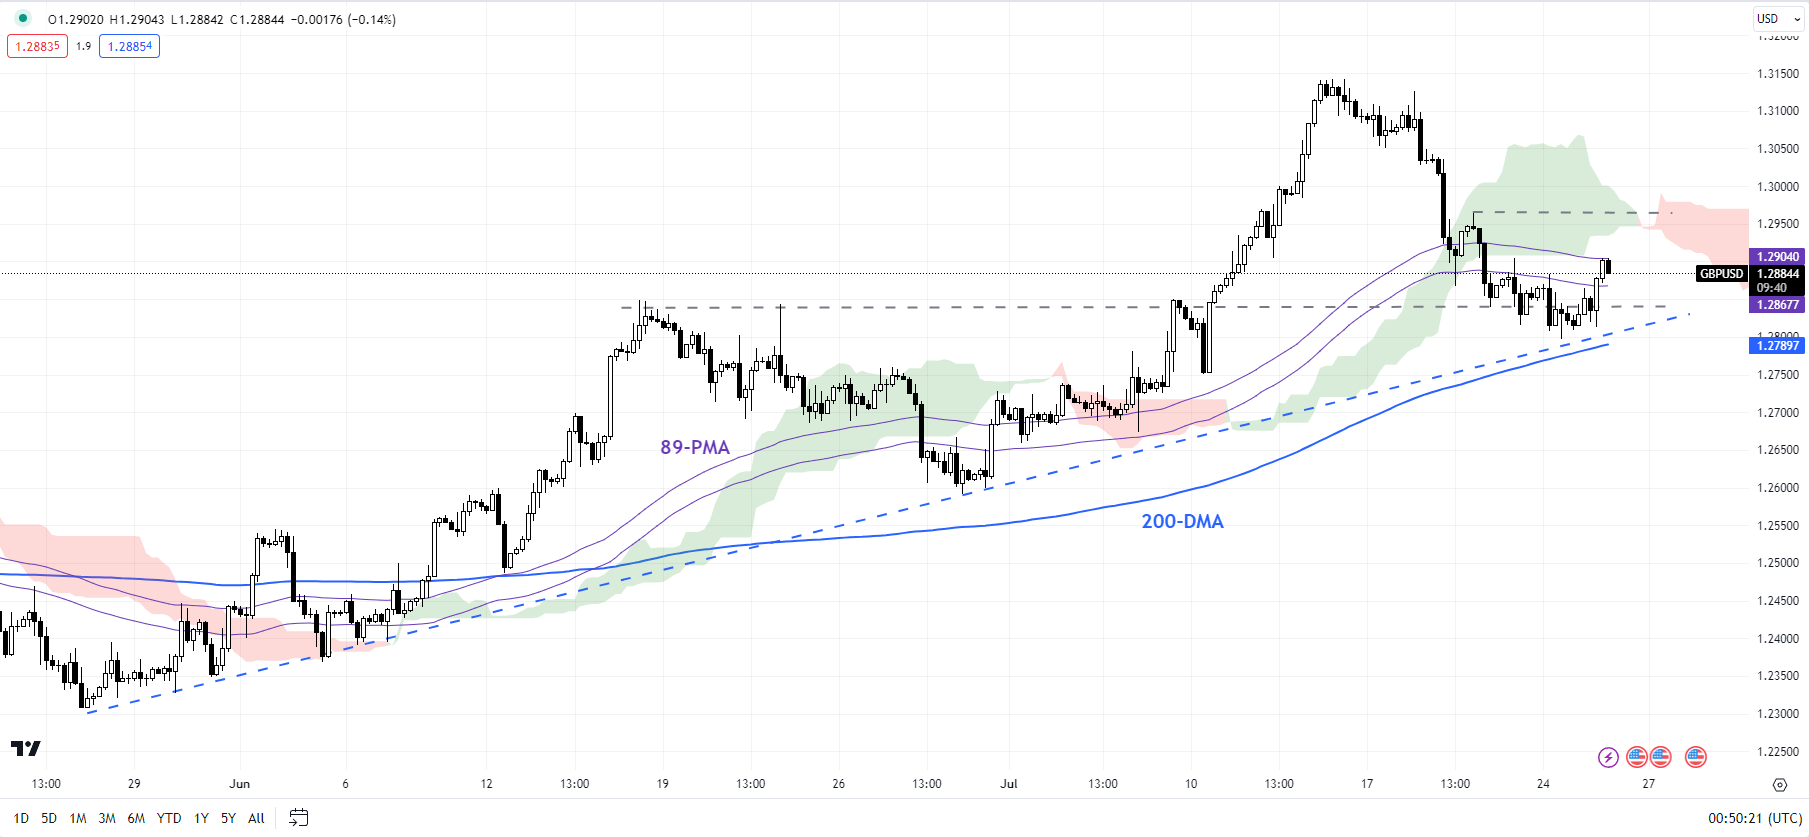
Chart Created by Manish Jaradi Using TradingView
However, a fall below a crucial floor that it is now testing could ease the upward pressure in the short term. The converged support is around 1.2800, including an uptrend line from the end of June, and the mid-June high of 1.2850. Only a break below the end-June low of 1.2600 would change the broader trend. On the upside, GBP/USD needs to rise above the initial cap at Thursday’s high of 1.2965 for the immediate downward pressure to reverse.
USD/JPY 240-minute Chart
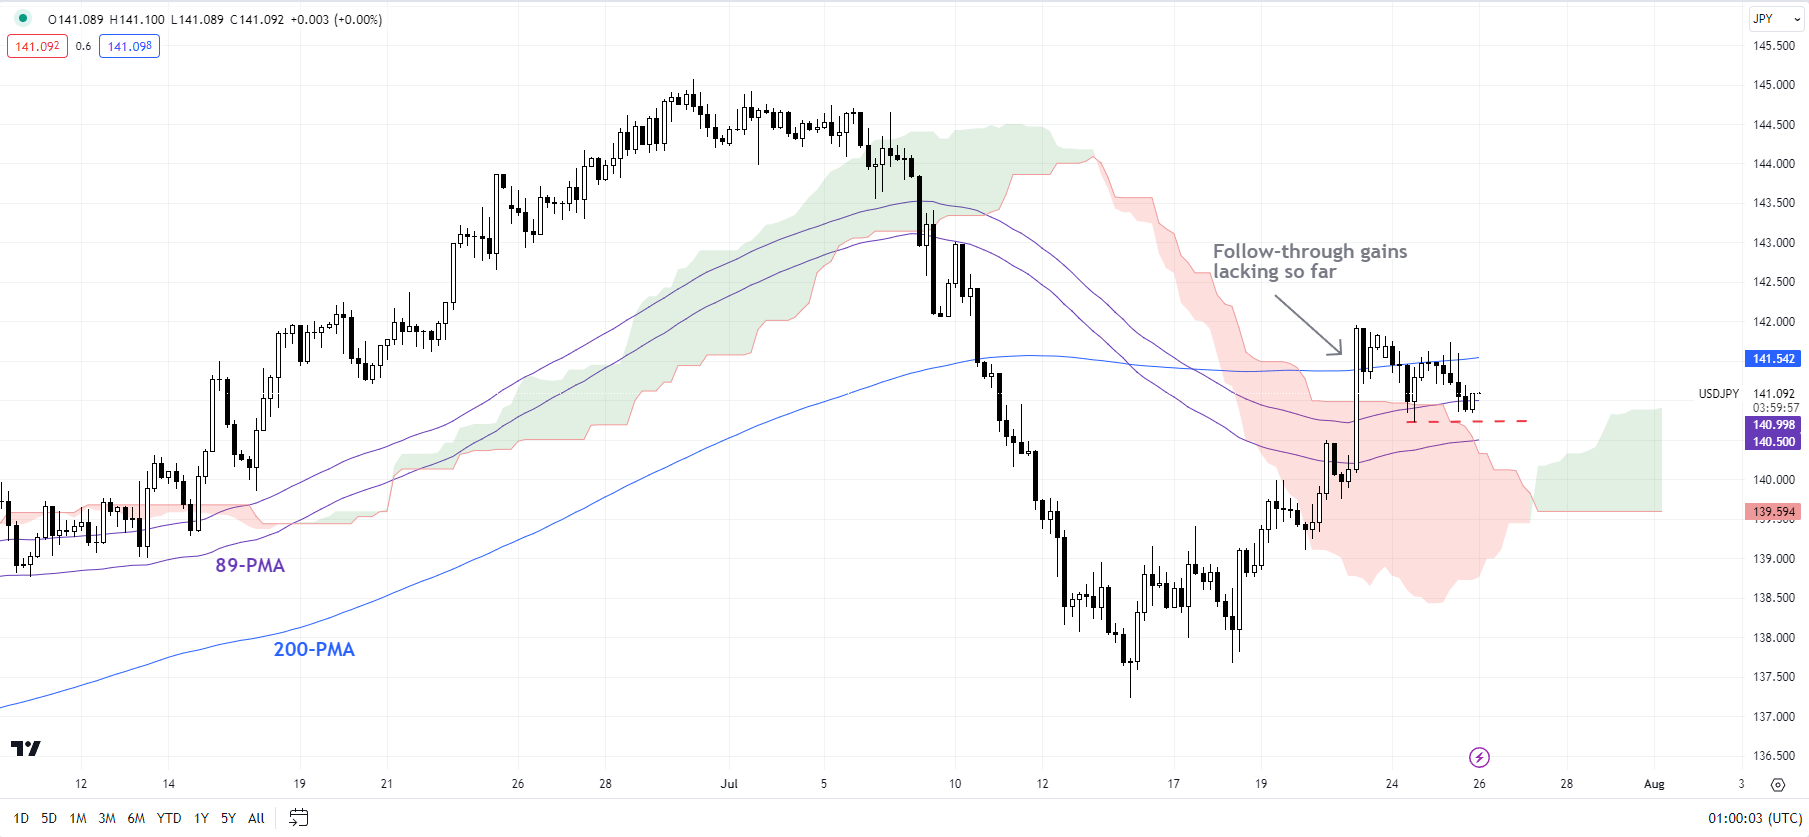
Chart Created by Manish Jaradi Using TradingView
USD/JPY: A false bullish candle?
The wide bullish candle posted on the daily charts raises the prospect of a ‘last hurrah’ USD/JPY’s rebound this month. This comes about around quite strong resistance at 142.00 (the 61.8% retracement of the early-July fall). A drop below immediate support at Monday’s low of 140.75 would raise the odds of a false move higher last week.
USD/JPY Daily Chart
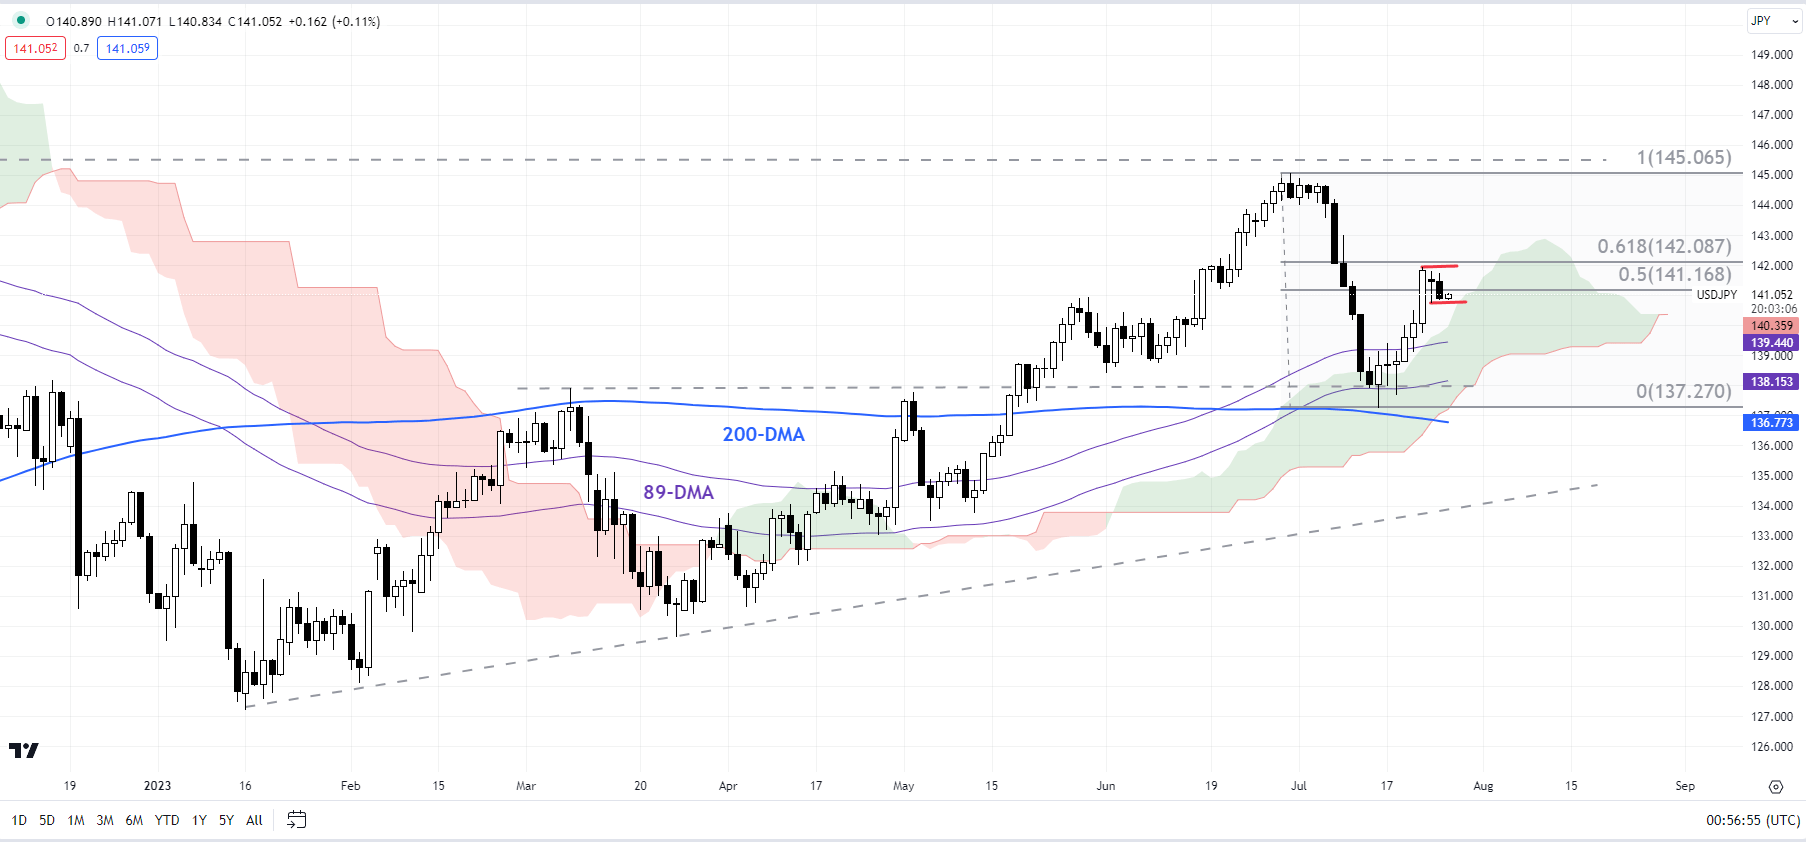
Chart Created by Manish Jaradi Using TradingView
On the other hand, a rise above Friday’s high of 142.00 would indicate an extension of the move toward the June high of 145.00.

--- Written by Manish Jaradi, Strategist for DailyFX.com
--- Contact and follow Jaradi on Twitter: @JaradiManish