


RAND TALKING POINTS & ANALYSIS
- Hawkish Fed & poor local data weighs negatively on rand.
- Fed’s Bostic in focus later today.
- Possible ascending triangle breakout on USD/ZAR daily chart.
Trade Smarter - Sign up for the DailyFX Newsletter
Receive timely and compelling market commentary from the DailyFX team
USD/ZAR FUNDAMENTAL BACKDROP
The South African rand steadily weakens against the USD on the back of poor local economic data and higher US Treasury yields. Yesterday’s ABSA Manufacturing PMI slumped to its lowest levels since July 2021 while the US reports surprised to the upside, highlighting the divergence between the two economies. Some hawkish guidance from Fed officials (Mester) earlier this morning (refer to economic calendar below) added to the restrictive monetary policy narrative but with Atlanta Fed Chief Raphael Bostic (known dove) to come, the less accommodative stance could be favored.
China’s National Day Golden Week will limit commodity trade and with China being a major partner with South Africa, the combination with a stronger dollar and weaker commodity prices have resulted in a softer rand.
Concerns around a global economic slowdown have favored the safe haven dollar particularly against Emerging Market currencies (EM’s) like the ZAR and if Treasury yields continue to stay elevated, the rand may suffer in line with this move.
USD/ZAR ECONOMIC CALENDAR (GMT +02:00)
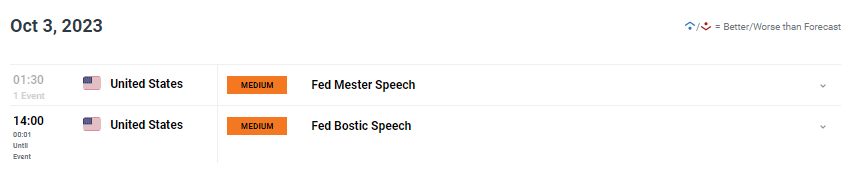
Source: DailyFX Economic Calendar
TECHNICAL ANALYSIS
USD/ZAR DAILY CHART
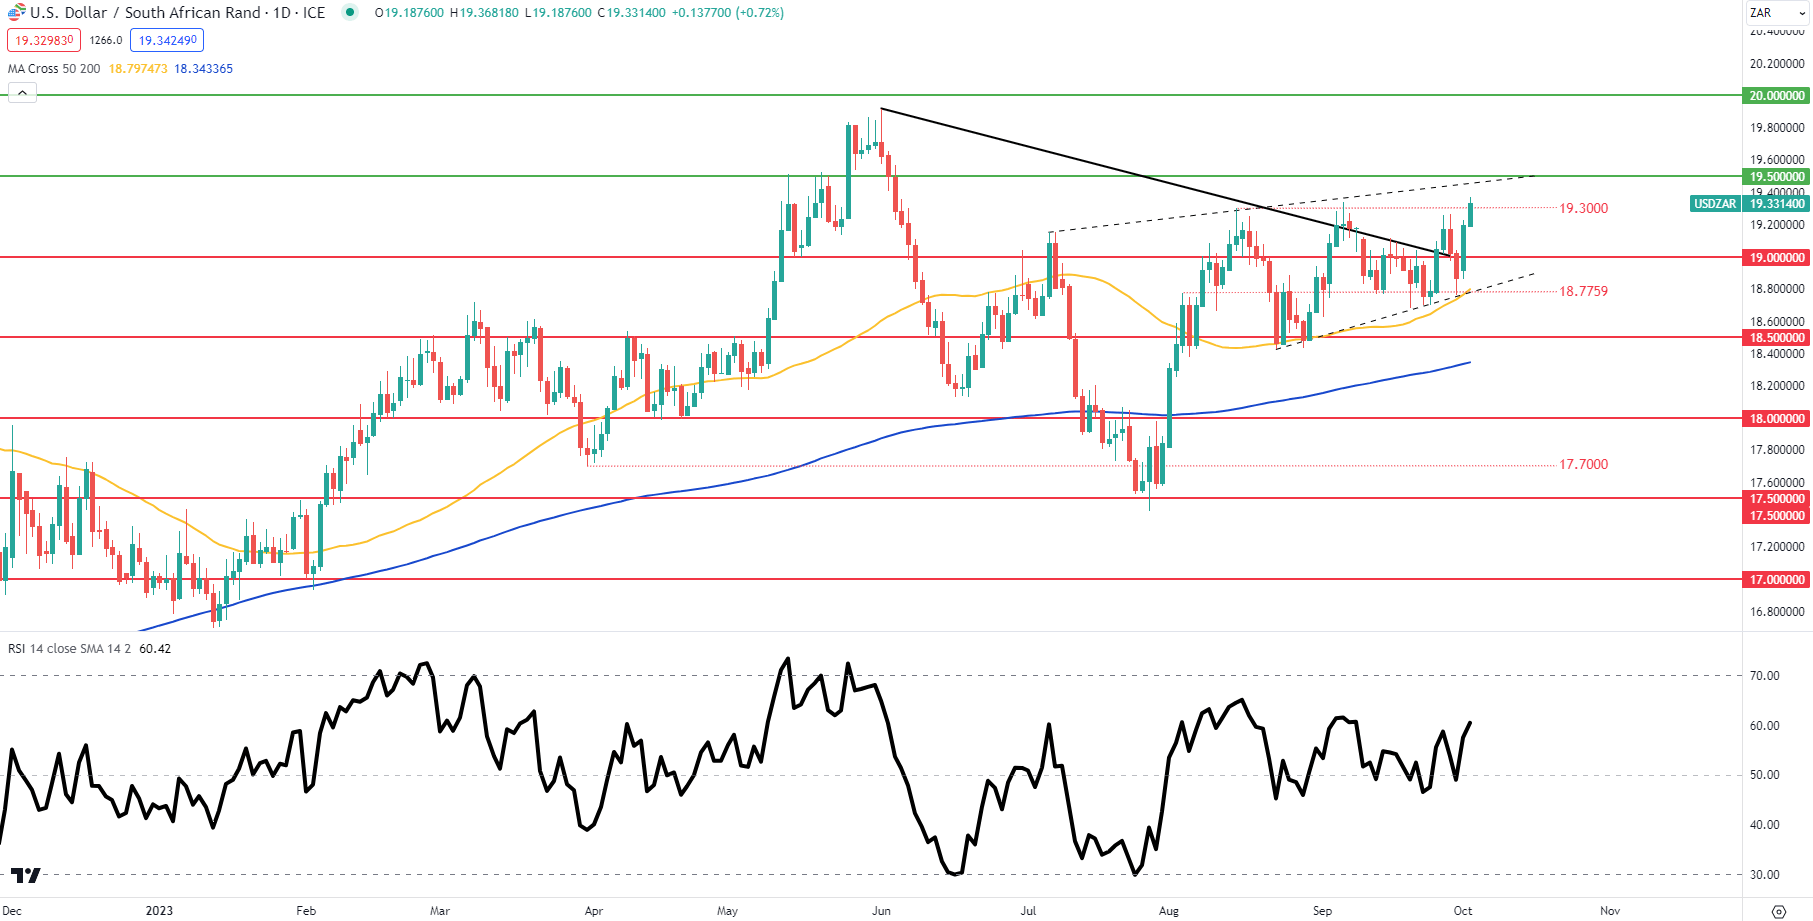
Chart prepared by Warren Venketas, TradingView
Daily USD/ZAR price action shows bulls testing the 19.3000 resistance handle for the third time since mid-August. This third touchpoint now forms a horizontal trendline resistance level now resembling a short-term ascending triangle. That being said, the longer-term rising wedge pattern (dashed black line) may hint at a brief upside rally after which we could see a pullback towards 19.0000 and beyond.
Introduction to Technical Analysis
Candlestick Patterns
Recommended by Warren Venketas
Resistance levels:
- 19.5000/Wedge Resistance
Support levels:
- 19.3000
- 19.0000
- 18.7759/Wedge support/50-day MA (yellow)
Contact and followWarrenon Twitter:@WVenketas


