


POUND STERLING ANALYSIS & TALKING POINTS
- Risk on sustaining GBP.
- Highly anticipated US NFP report the focal point for today.
- GBP/USD daily chart suggests impending rising wedge breakout.

GBPUSD FUNDAMENTAL BACKDROP
The British pound looks to be aiming for a 3 day rally against the USD following a dovish Federal Reserve, hawkish European Central Bank (ECB) and positive UK economic data yesterday (services PMI). This Friday will kick off with UK construction PMI data (see economic calendar below) which is expected to print higher than the March figure. The primary data point for cable today will come via the US Non-Farm Payroll (NFP) report with 180K the projected figure. Average earnings forecasts are in line with the prior print but anything lower could support the recent dovish repricing of Fed interest rates going forward.
Trade Smarter - Sign up for the DailyFX Newsletter
Receive timely and compelling market commentary from the DailyFX team
ECONOMIC CALENDAR
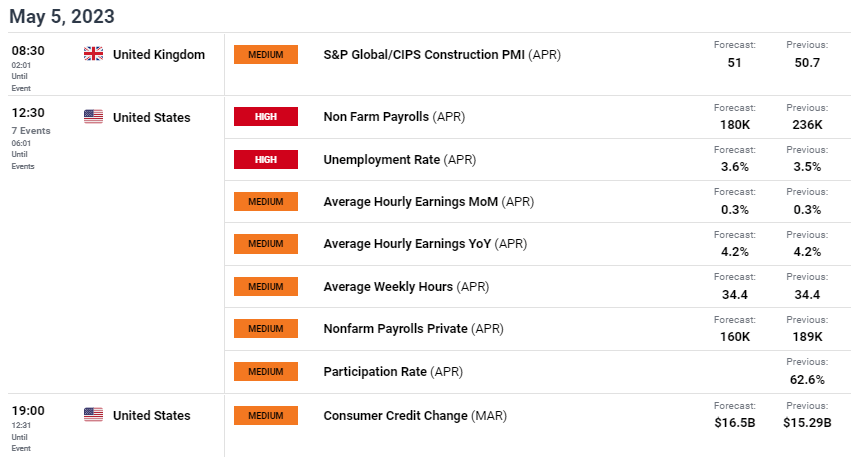
Source: DailyFX Economic Calendar
Money markets are pricing in additional rate hikes after next week’s Bank of England (BoE) announcement but may be an overestimation. It is likely UK data could limit this aggressive pricing leaving the pound exposed to some downside.
BANK OF ENGLAND INTEREST RATE PROBABILITIES
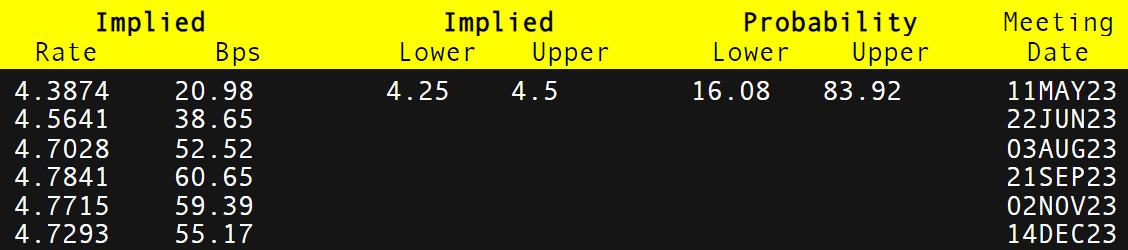
Source: Refinitiv
TECHNICAL ANALYSIS
GBP/USD DAILY CHART
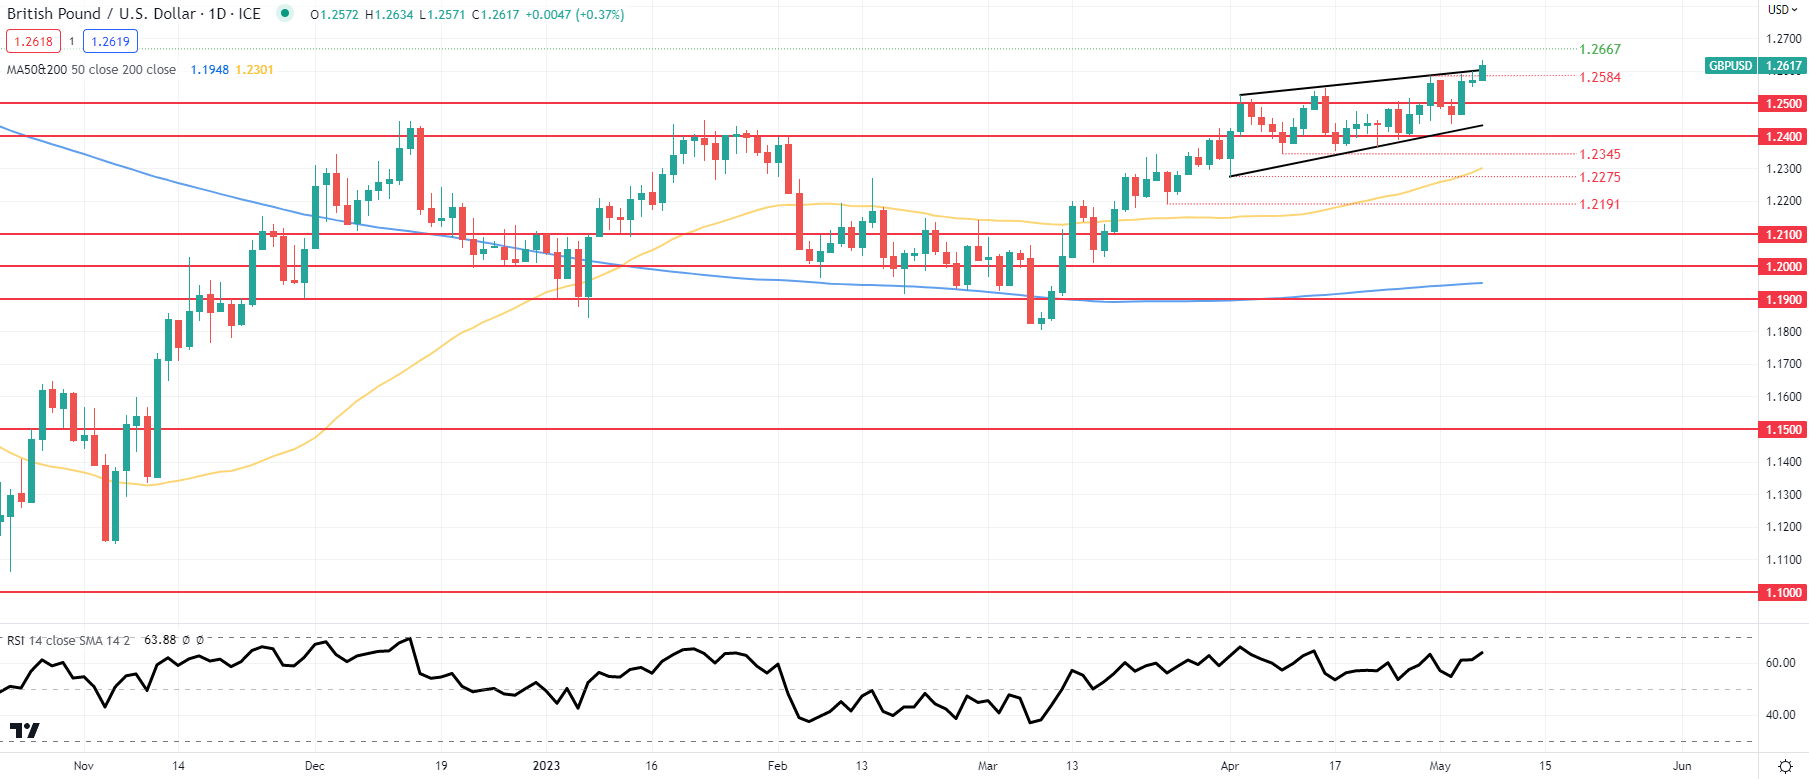
Chart prepared by Warren Venketas, IG
Daily GBP/USD price action now looks to test the evolving rising wedge chart pattern (black) at its resistance. With the pair already reaching new 2023 highs today, a confirmation close above wedge resistance could invalidate the pattern and open up room towards the May 2022 swing high at 1.2667. That being said, the Relative Strength Index (RSI) continues to hover around the overbought zone and continues to suggest bearish divergence, so a medium-term bearish bias is favorable from a technical analysis standpoint.
Key resistance levels:
- 1.2667
- Wedge resistance
- 1.2500
Key support levels:
- 1.2584
- 1.2500
- Wedge support
- 1.2400
BULLISH IG CLIENT SENTIMENT
IG Client Sentiment Data (IGCS) shows retail traders are currently net SHORT on GBP/USD with 67% of traders net short (as of this writing). At DailyFX we typically take a contrarian view to crowd sentiment resulting in a short-term upside bias.
Contact and followWarrenon Twitter:@WVenketas


