


Australian Dollar Outlook:
- AUD/USD rates remain in a symmetrical triangle that has been forming since early-May.
- Meanwhile AUD/JPY rates have already traded higher through triangle resistance, suggesting that more gains may be ahead.
- According to the IG Client Sentiment Index, both AUD/JPY and AUD/USD rates have bullish biases in the near-term.

The Worst Over?
It’s been a rough few weeks for the Australian Dollar, but the worst may be over. As commodity prices churn higher, the major commodity currencies have enjoyed a tailwind in recent days. And now that risk appetite is broadly improving as evidenced by gains in global equity markets, it may be the case that higher yielding, risk-sensitive currencies begin to benefit as well.
While both AUD/JPY and AUD/USD rates have been consolidating in triangles in recent weeks and months, technical evidence is accumulating that continued bullish trading may be ahead in stark contrast to seasonal tendencies.
AUD/USD RATE TECHNICAL ANALYSIS: DAILY CHART (March 2020 to October 2021) (CHART 1)

In mid-September it was noted that “AUD/USD rates may be showing signs of basing after declining on a near-linear path for most of September.” The start of October has emboldened this narrative, with more evidence accumulating that the pair is starting to turn higher.
AUD/USD rates are above their daily 5-, 8-, 13-, and 21-EMA envelope, which is now in bullish sequential order. Daily MACD is nearing a turn higher above its signal line, while daily Slow Stochastics are rapidly climbing towards overbought territory. A move above 0.7350 would suggest that the multi-month consolidation has ended in favor of a bullish breakout.
IG Client Sentiment Index: AUD/USD RATE Forecast (October 7, 2021) (Chart 2)
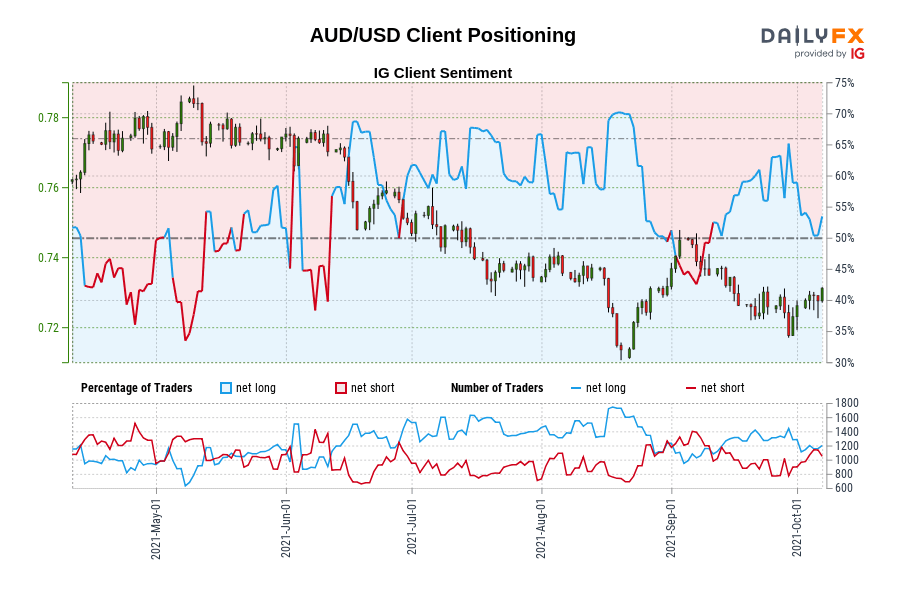
AUD/USD: Retail trader data shows 52.42% of traders are net-long with the ratio of traders long to short at 1.10 to 1. The number of traders net-long is 0.72% lower than yesterday and 10.31% lower from last week, while the number of traders net-short is 8.10% higher than yesterday and 24.42% higher from last week.
We typically take a contrarian view to crowd sentiment, and the fact traders are net-long suggests AUD/USD prices may continue to fall.
Yet traders are less net-long than yesterday and compared with last week. Recent changes in sentiment warn that the current AUD/USD price trend may soon reverse higher despite the fact traders remain net-long.
AUD/JPY RATE TECHNICAL ANALYSIS: DAILY CHART (March 2020 to October 2021) (CHART 3)

There are two different potential triangles in place for AUD/JPY rates, with support coming at August and September swing lows, and resistance measured from either (1) the late-June and September swing highs or (2) the mid-July and September swing highs. No matter how you slice it, though, AUD/JPY rates have broken through triangle resistance today, suggesting that a bullish breakout is getting started.
AUD/JPY rates are above their daily EMA envelope, which is in bullish sequential order. Daily MACD continues to trend higher above its signal line, while daily Slow Stochastics have risen into overbought territory. Bullish targets for triangle breakouts are 82.82 (July 13 high) and 85.05 (June 11 high).
IG Client Sentiment Index: AUD/JPY Rate Forecast (October 7, 2021) (Chart 4)
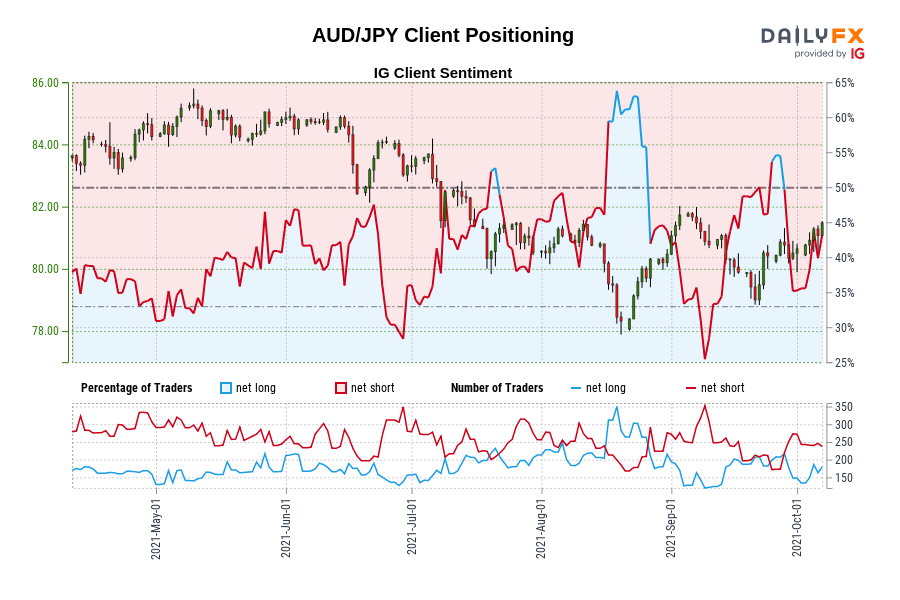
AUD/JPY: Retail trader data shows 38.26% of traders are net-long with the ratio of traders short to long at 1.61 to 1. The number of traders net-long is 7.39% lower than yesterday and 7.91% lower from last week, while the number of traders net-short is 13.36% higher than yesterday and 3.14% higher from last week.
We typically take a contrarian view to crowd sentiment, and the fact traders are net-short suggests AUD/JPY prices may continue to rise.
Traders are further net-short than yesterday and last week, and the combination of current sentiment and recent changes gives us a stronger AUD/JPY-bullish contrarian trading bias.

--- Written by Christopher Vecchio, CFA, Senior Strategist


