


USD/CAD Analysis
- Crucial April inflation data may set the scene for a softer dollar
- Key technical levels for USD/CAD considered after bounce of major resistance zone
Crucial Inflation Data May Provide Short-Term Pullback
As we rump up to one of the most anticipated US CPI prints in recent months, it makes sense to take stock of possible short-term reactions that may follow. Headline inflation - the price of a typical basket of goods and services including volatile items like food and fuel - has had a knack of beating expectations ever since printing above 2% in April last year.
In fact, since then we are yet to witnesses a single case where headline inflation printed below the forecasted value, owing to supply chain shortages which were exacerbated by the invasion of Ukraine, as well as large scale money printing in line with accommodative monetary policy.
Somewhat in contrast, core inflation - the measure of inflation excluding volatile items like food and fuel – has had two inflation prints where the actual figure came in under the forecast. Such an occasion was in last month’s print where a 0,1% miss in core inflation resulted in a sizeable drop in the dollar in the 30 minutes that followed the print.
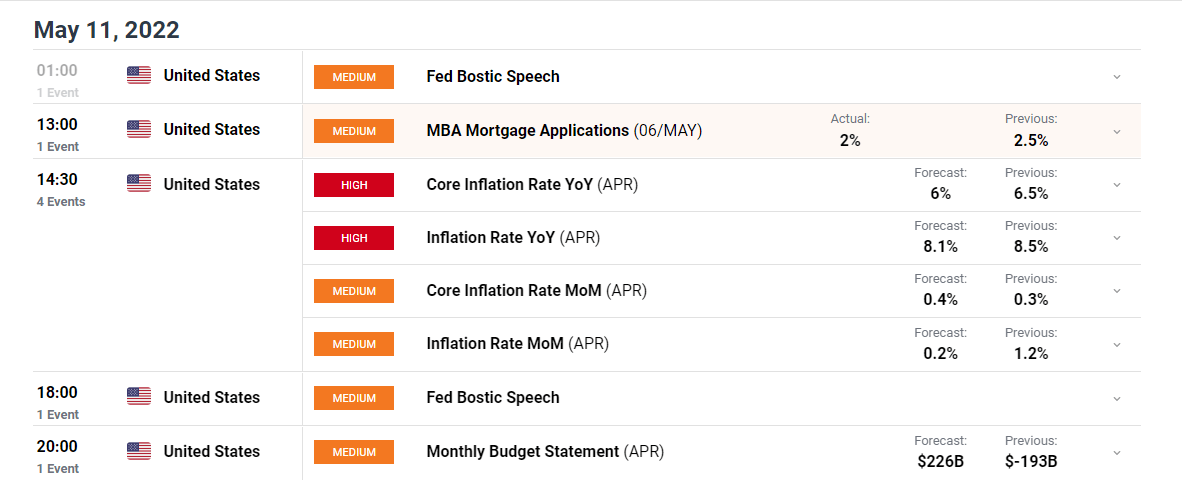
Customize and filter live economic data via our DaliyFX economic calendar
It is under this lens that we consider dollar pairs for the possibility of short-term dollar weakness. It must be stated beforehand that even if core and headline inflation print lower than forecasted, the longer-term trend of a strong dollar, elevated inflation and aggressive rate hikes (US) remain entrenched, for now.
Core inflation is likely to attract a closer look from market participants interested to find out if inflation’s grip on the broader economy is beginning to loosen. Therefore, USD/CAD poses an interesting setup should we see a core inflation print below 6%.
USD/CAD Key Technical Levels
Looking at USD/CAD, its no secret that the US dollar has been running hot, buoyed by the initial safe-haven appeal of the Ukraine invasion, now being supported by an aggressive rate hiking cycle by the Federal Reserve Bank. Earlier today we have seen what can be described as the market front-running a potentially lower inflation data print as USD/CAD reversed off the topside of the zone of resistance at 1.3030.

A break below 1.2960 could lead to an impulsive move to 1.2895. The RSI appears to have turned lower just short of breaching oversold territory, although we have seen bearish reversals from similar levels on the RSI in the past. One fundamental factor that may pose a challenge to the longevity of the potential move is the fact that oil prices have softened recently as concerns over global demand appear to outweigh supply fears concerning the EU’s proposal to ban all Russian oil.
Resistance currently lies at 1.3030 but could move to 1.2960 if we witness a move lower in USD/CAD after the inflation print.
USD/CAD Daily Chart
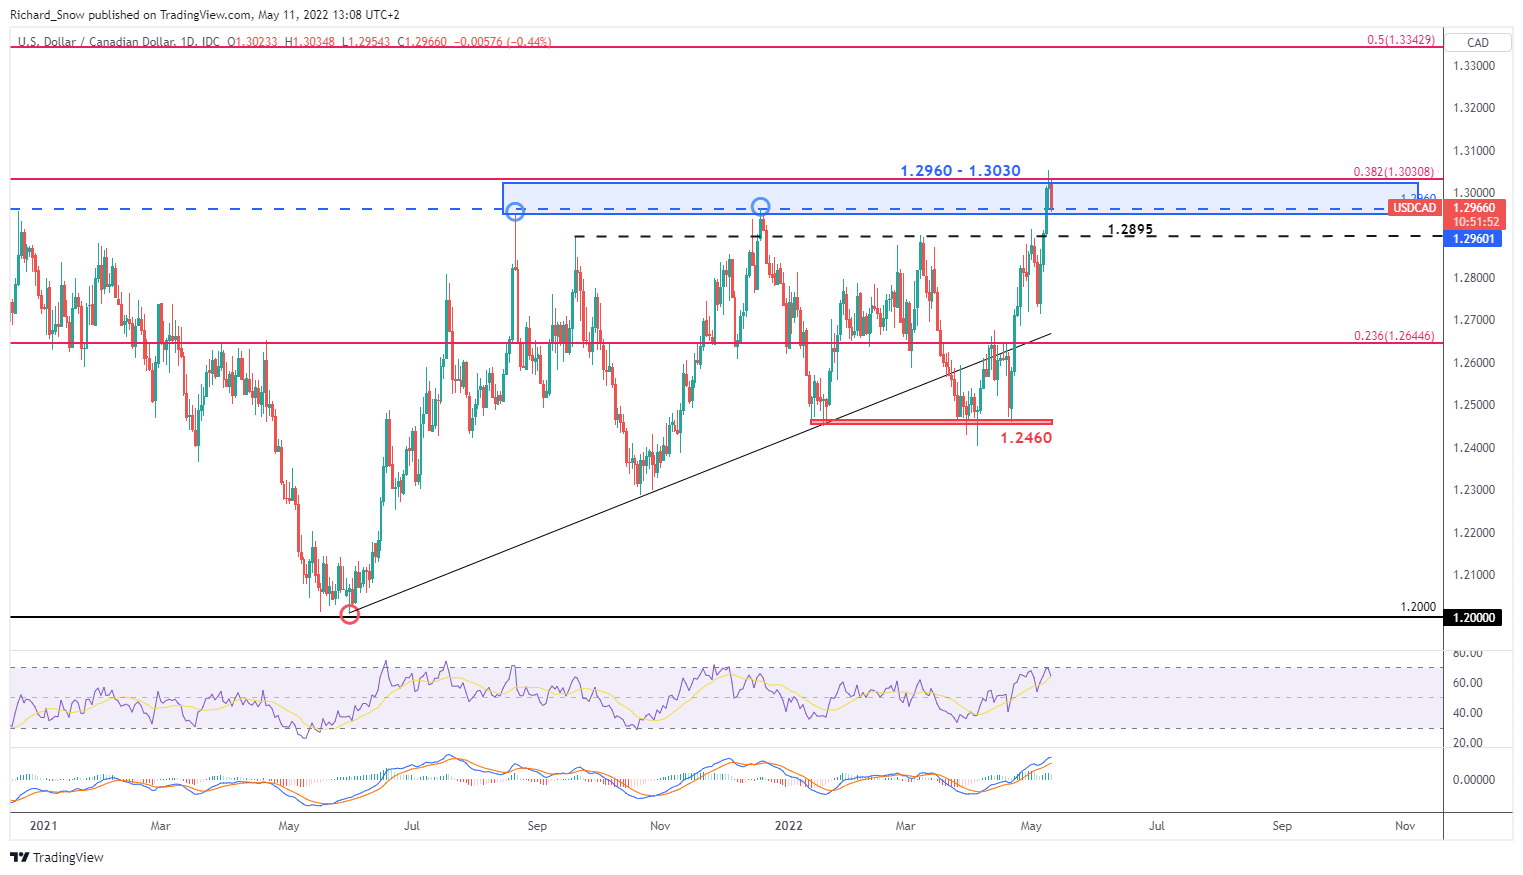
Source: TradingView, prepared by Richard Snow
The weekly USD/CAD chart underscores the significance of the zone of resistance (blue rectangle) as it coincides with prior resistance of 1.2960 and the 38.2% Fib level of the March 2020 major move lower.
USD/CAD Weekly Chart
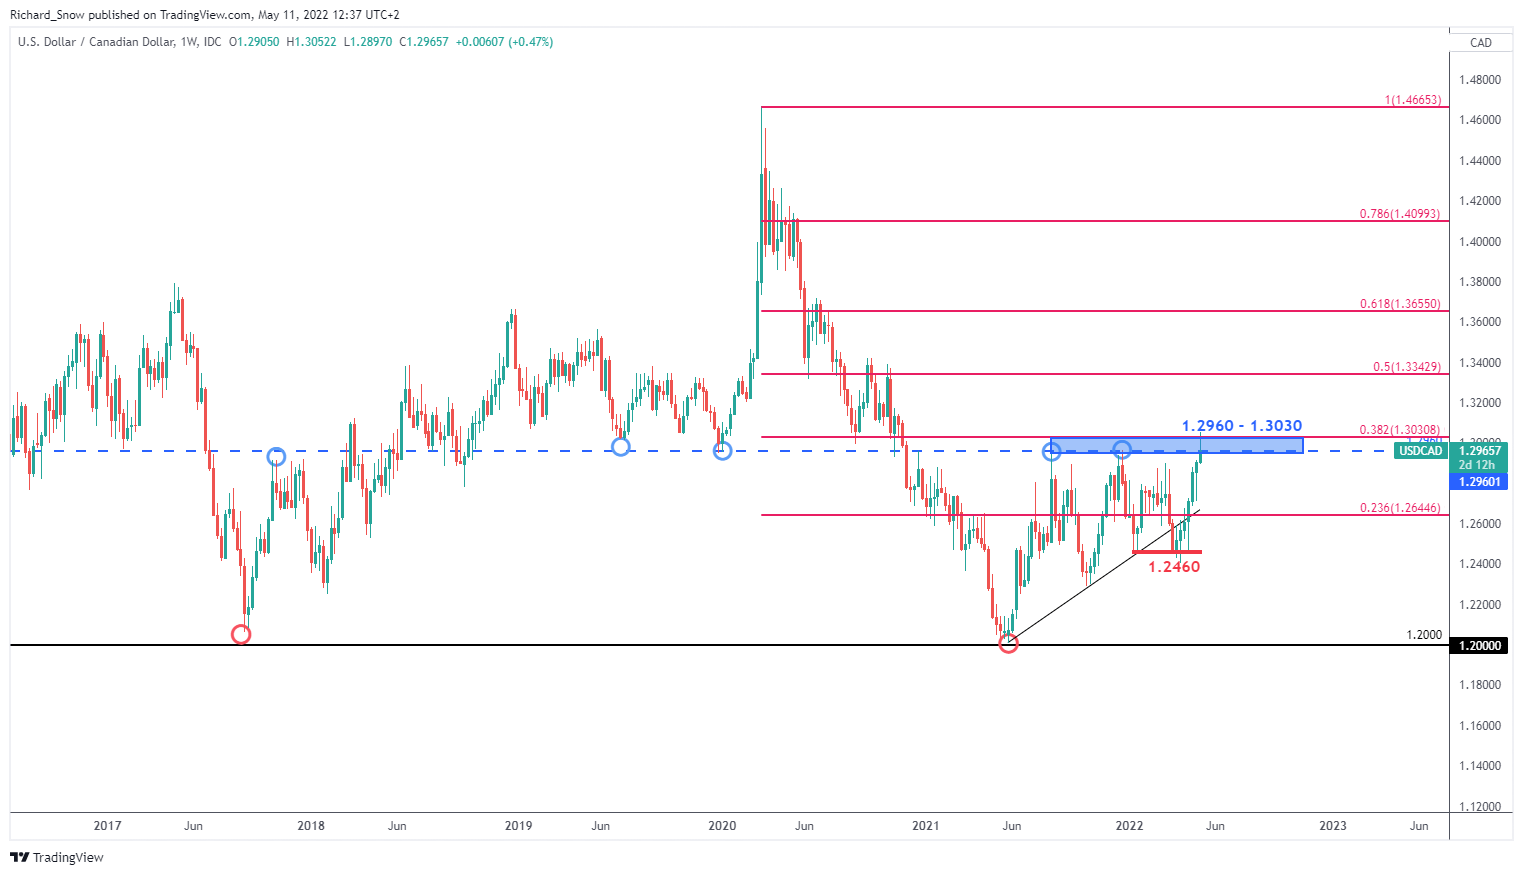
Source: TradingView, prepared by Richard Snow
| Change in | Longs | Shorts | OI |
| Daily | 62% | -19% | 7% |
| Weekly | 14% | -3% | 5% |
Trade Smarter - Sign up for the DailyFX Newsletter
Receive timely and compelling market commentary from the DailyFX team
--- Written by Richard Snow for DailyFX.com
Contact and follow Richard on Twitter: @RichardSnowFX


