


GBP price, UK bank stocks, FTSE 100 news and analysis:
- The UK’s banks have suspended dividends to shareholders, sending bank stocks plunging and weakening the FTSE 100 index.
- However, Sterling is holding steady against a firmer US Dollar.
GBP/USD stable as bank stocks sell off
UK bank stocks fell sharply Wednesday after the banks agreed to cut dividends to shareholders, increasing the cash available to bolster the economy against the damage caused by the coronavirus pandemic. The banks have also been urged by the Bank of England not to pay bonuses to senior staff.
In a statement, the BoE’s Prudential Regulation Authority said: “Although the decisions taken today will result in shareholders not receiving dividends, they are a sensible precautionary step given the unique role that banks need to play in supporting the wider economy through a period of economic disruption.”
In response, there were opening losses of between 5% and 8% for stocks in banks such as Barclays, HSBC, Lloyds, Royal Bank of Scotland and Standard Chartered, sending the FTSE 350 bank stocks index slumping.
FTSE 350 Banks Price Chart, 30-Minute Timeframe (March 26 – April 1, 2020)
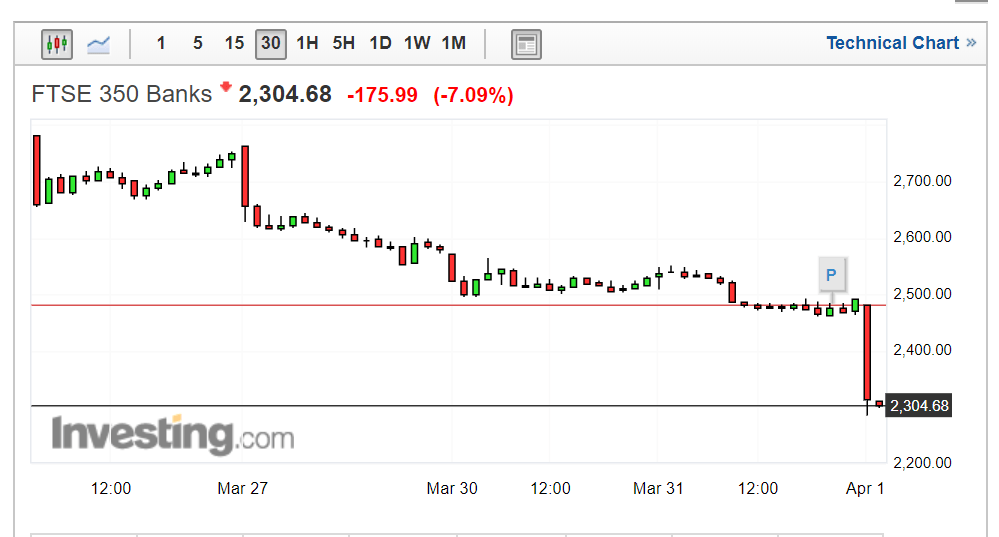
Source: Investing.com (You can click on it for a larger image)

That weakened the FTSE 100 index of leading London-listed stocks but GBP/USD held steady against a rising US Dollar that is still serving as a safe haven as the pandemic continues to raise fears of a global recession, particularly after a poor set of purchasing managers’ indexes for the manufacturing sectors of many Asian countries.
GBP/USD Price Chart, Two-Hour Timeframe (March 20 – April 1, 2020)
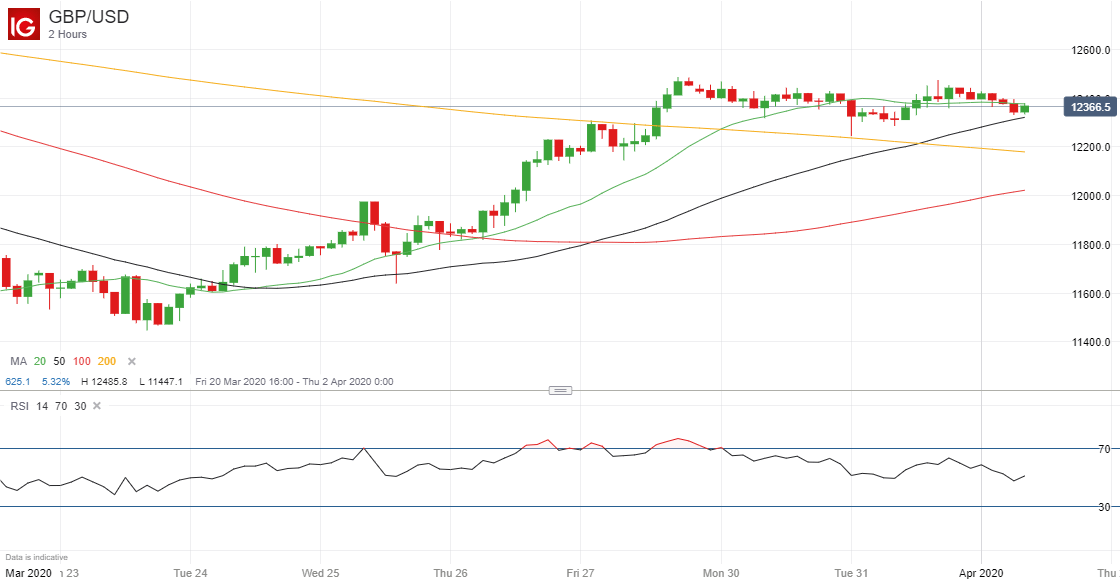
Source: IG (You can click on it for a larger image)
| Change in | Longs | Shorts | OI |
| Daily | -9% | 3% | -4% |
| Weekly | -8% | 5% | -2% |
We look at Sterling regularly in the DailyFX Trading Global Markets Decoded podcasts that you can find here on Apple or wherever you go for your podcasts
--- Written by Martin Essex, Analyst and Editor
Feel free to contact me via the comments section below


