


Bitcoin (BTC) News, Price, Chart and Analysis:
- Latest rally fades as BTC moves out of oversold territory.
- 20- and 200-day crossover nears, fueling bearish momentum.
A Guide to Day Trading Bitcoin and Other Cryptocurrencies
Bitcoin (BTC) Sell-Off May Continue, Charts Warn
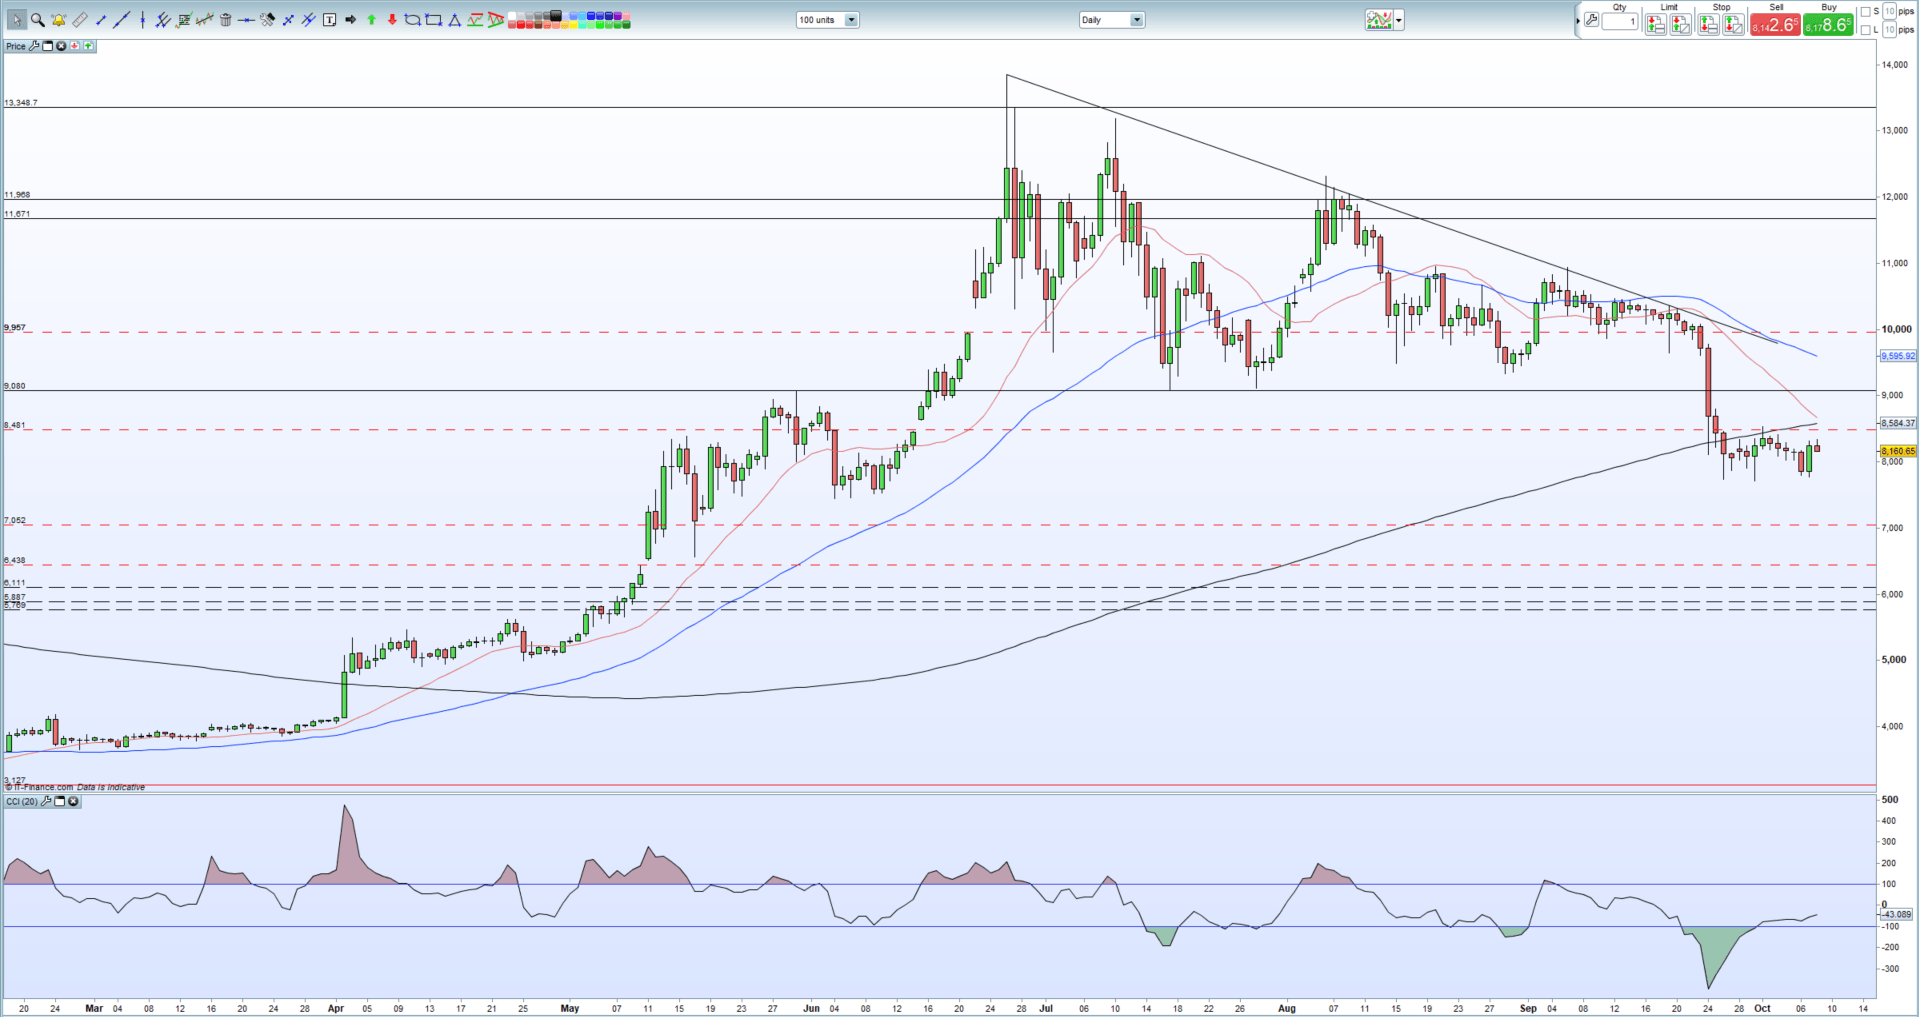
Monday’s cryptocurrency mini-rally looks to have run its course with the 200-day moving average capping any upside breakout. Bitcoin has traded below the longer-dated ma for nearly two weeks and needs a driver to break and close above this important technical indicator. In addition, the 20-day ma is looking set to break below the 200-dma, highlighting the current negative sentiment.
If we look at the 50-day moving average - the blue line on the chart – we can see that this is now approaching the 200-dma, warning of a potential ‘death cross’. Back on April 24 this year, the 50-dma broke above the 200-dma, producing a bullish ‘golden cross’. Bitcoin rallied hard from this cross-over, moving from around $5,000 to this year’s high of $13,862. The two moving averages are now at their narrowest gap in around five months and continue to close on each other. If the 50-dma goes below the 200-dma, a ‘death cross’, this usually signals a further, potentially sharp, sell-off. While this cross-over may still take weeks to form, the daily Bitcoin chart is looking more ominous.
Short-term Bitcoin resistance is pegged off the October 1 high at $8,530 before a gap on the September 24 sell-off candle between $8,810 and $9,610. Initial support between $7,700 and $7.770 before a double low seen in early June at $7,450.
Bitcoin Daily Price Chart (February – October 8, 2019)
IG Client Sentiment data show that 82% of retail traders are net-long Bitcoin (BTC), a bearish contrarian indicator.
Traders may be interested in two of our trading guides – Traits of Successful Traders and Top Trading Lessons – while technical analysts are likely to be interested in our latest Elliott Wave Guide.
What is your view on Bitcoin (BTC) – bullish or bearish?? You can let us know via the form at the end of this piece or you can contact the author at nicholas.cawley@ig.com or via Twitter @nickcawley1.


