
EUR/USD TECHNICAL ANALYSIS
EUR/USD regained strength on Thursday and managed to bounce off horizontal support at 1.0640/1.0600 following Wednesday’s steep sell-off. While the euro’s prospects have started to deteriorate in recent days, the bullish case should not be written off just yet, as buyers appear to be returning to the market and seem intent on challenging a key ceiling located a tad below the psychological 1.0800 mark.
The next few sessions will be critical and may help determine the near-term directional bias, so traders should carefully watch how price action evolves and how it reacts around major tech zones. That said, there are two possible scenarios worth considering: 1) clearance of cluster resistance stretching from 1.0750 to 1.0785, and 2) upside exhaustion and rejection from current levels.
If the first scenario plays out and buyers drive the exchange rate above 1.0750/1.0785, sentiment could take a turn for the better, paving the way for a move toward the 50-day simple moving average, which is hovering slightly below the 1.0900 handle. In contrast, if the second scenario unfolds and sellers spark a bearish reversal, EUR/USD may soon be on its way to retesting its May lows.

EUR/USD TECHNICAL CHART
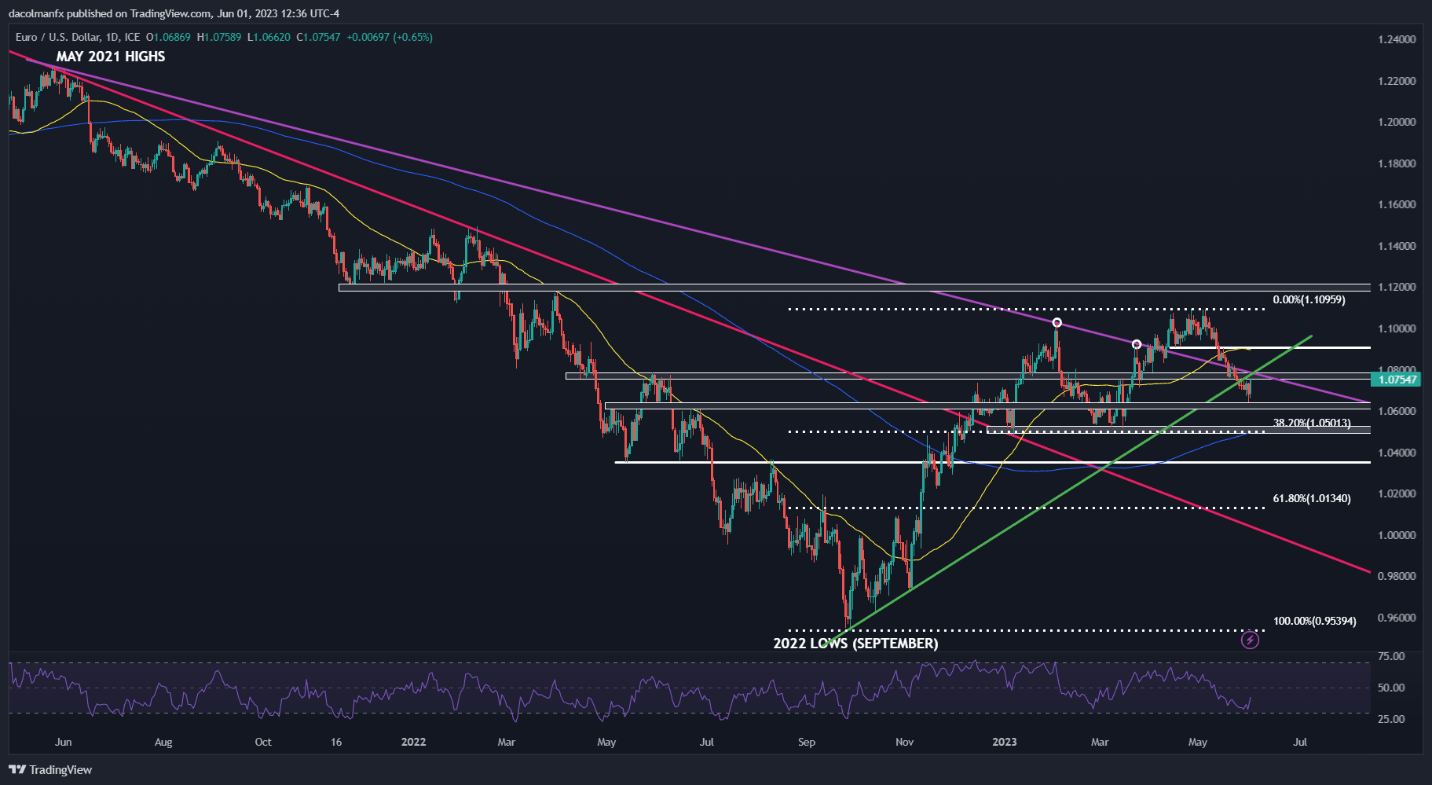
EUR/USD Chart Prepared Using TradingView
USD/JPY TECHNICAL ANALYSIS
USD/JPY rallied in May on bets that the Fed would continue lifting rates at upcoming FOMC meetings, but expectations have shifted in a more dovish direction in the last couple of days after some officials came out in support of a “pause” to assess the lagged effects of past tightening. In this context, markets have largely priced out the likelihood of a 25 bp hike in June, leading to a pullback in the U.S. dollar.
In terms of technical analysis, USD/JPY began to retrench after failing to clear overhead resistance located modestly above the psychological 140.00 mark. Sellers retook control of the market from those levels, pushing prices back toward the 138.00 area – the next major support in play. If this floor gives way in the coming sessions, bears may become emboldened to launch an attack on short-term trendline support near 135.90.
On the flip side, if USD/JPY pivots higher and resumes its upward trek, the first resistance to keep an eye on lies at 140.50/140.90. Successfully piloting above this ceiling could reinforce upward momentum, opening the door for climb toward 142.45, the 61.8% Fibonacci retracement of the October 2022/January 2023 decline.

USD/JPY TECHNICAL CHART
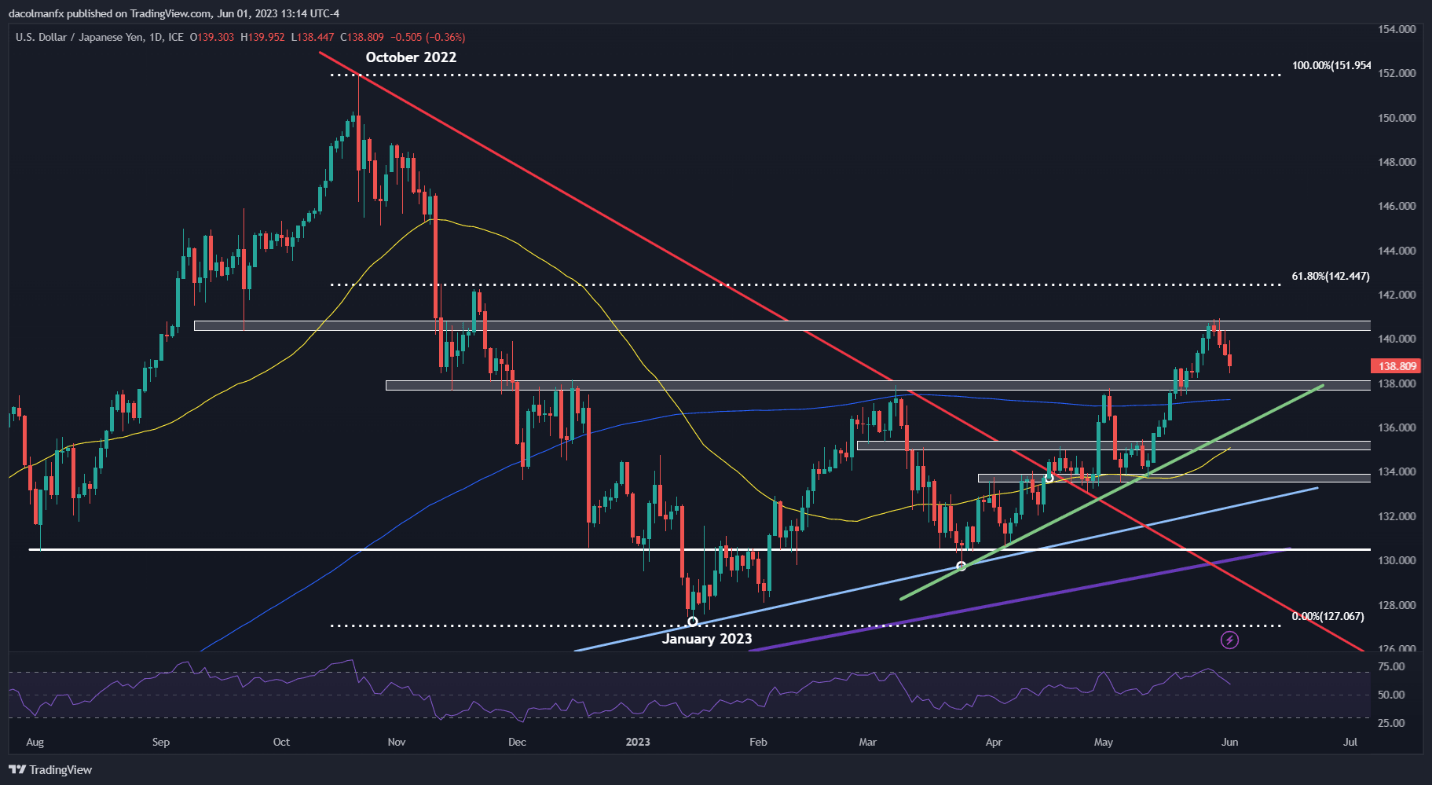
USD/JPY Technical Chart Prepared Using TradingView
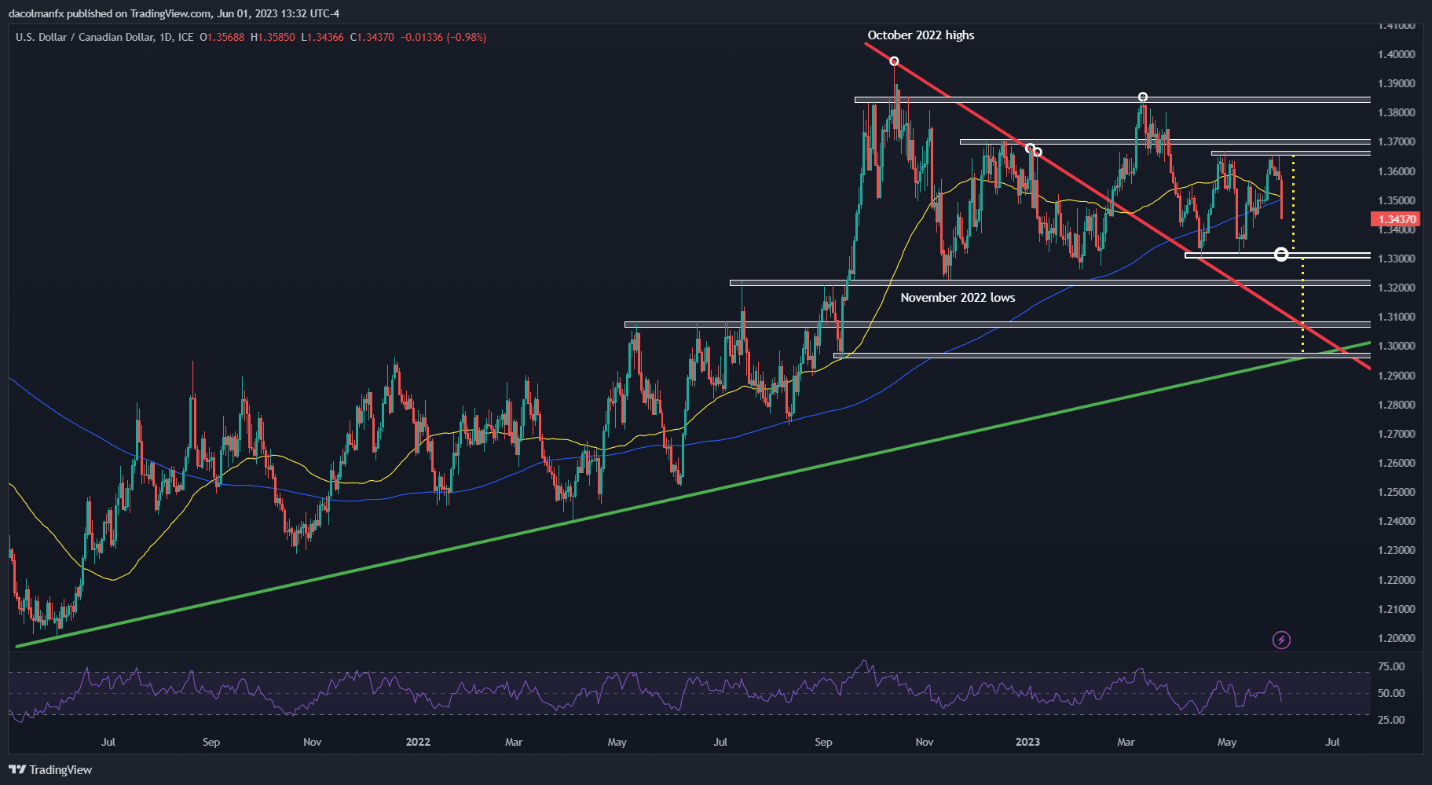
USD/CAD TECHNICAL ANALYSIS
USD/CAD rallied toward its April highs earlier this week, but was quickly repelled lower from those levels, with the pair selling off and seemingly carving out the second leg of a double top pattern on Thursday – a bearish configuration according to technical analysis.
A double top is a reversal pattern that often develops in the context of an extended move higher, composed of two similar peaks separated by an intermediate trough. The setup is confirmed once the price completes its “M” shape and breaks below the neckline which serves as a base for the pattern. In the case at hand, the neckline sits slightly above the 1.3300 handle.
The likely size of the downward move can be quantified by projecting vertically the height of the double top from the break point. For USD/CAD, this could mean a potential slump toward 1.2960 over a medium-term horizon.
| Change in | Longs | Shorts | OI |
| Daily | 42% | -26% | -3% |
| Weekly | 6% | -10% | -3% |
USD/CAD TECHNICAL CHART