


Brent, WTI Crude Oil Weekly Forecast: Bullish
- Key considerations: Iran, US sanctions and the Strait of Hormuz
- Brent crude oil surges towards $90 a barrel – is $100 a possibility?
- WTI oil heads higher despite large EIA storage build
- The analysis in this article makes use of chart patterns and key support and resistance levels. For more information visit our comprehensive education library
Key Considerations: Iran, US Sanctions and The Strait of Hormuz
Oil prices surged on Friday ahead of a ground offensive expected by Israel into northern Gaza. Earlier in the day Israel issues a warning to residents of northern Gaza and United Nations (UN) officials working in the area to evacuate within 24 hours – a task labelled as impossible by the humanitarian organization.
The Iranian foreign minister weighed in stating that the continuation of crimes against Palestinians would spark a response from “the rest of the axis” – an alliance of neighbouring Arab nations. Widespread speculation of Iranian involvement has not been confirmed but the possibility of further sanctions on Iranian oil has made its way into the media, sending oil markets notably higher on the day.
The threat of sanctions would only exacerbate an already tight oil market unless progress around Israel-Saudi relations – brokered by the US - leads to an agreement from Saudi Arabia to raise its production to offset the lost Iranian supply. Another concern for the oil markets appears via the Strait of Hormuz – which accounts for around 20% of global oil supply. Any blockage of the main arterial route for whatever reason would strain global oil stocks, sending prices even higher which threatens to reignite inflation concerns.
Brent Crude Oil 5-Mintue Chart

Source: TradingView, prepared by Richard Snow
Brent Crude Oil Surges Towards $90 a Barrel
Brent crude oil shot up on Friday after an unsuccessful attempt to close above $87 the day before. Oil markets have gone through a turbulent time, rising on the back of renewed commitment by OPEC+ to restrict supply until the end of 2024 and the further discretionary cuts from Saudi Arabia and Russia, and then falling in response to global growth concerns.
Oil market trading demands an understanding of the fundamental drivers of demand and supply that guide price action. Discover what these are by reading the essential fundamental guide below:

It is always challenging to anticipate the magnitude of moves during times of large-scale conflict, particularly in an area of the world so crucial to global oil supply. Therefore, areas of interest to the upside (resistance) appear via the 38.2% Fibonacci retracement at $91.42, followed by the prior swing high of around $95.60. Given the oil market is coming off a considerable decline, price action still has a fair distance to go before venturing into overbought territory. Immediate support appears at $89 upon a daily and weekly close above this level, with the swing low of $83.50 as the next level of consideration.
Brent Crude Oil Daily Chart
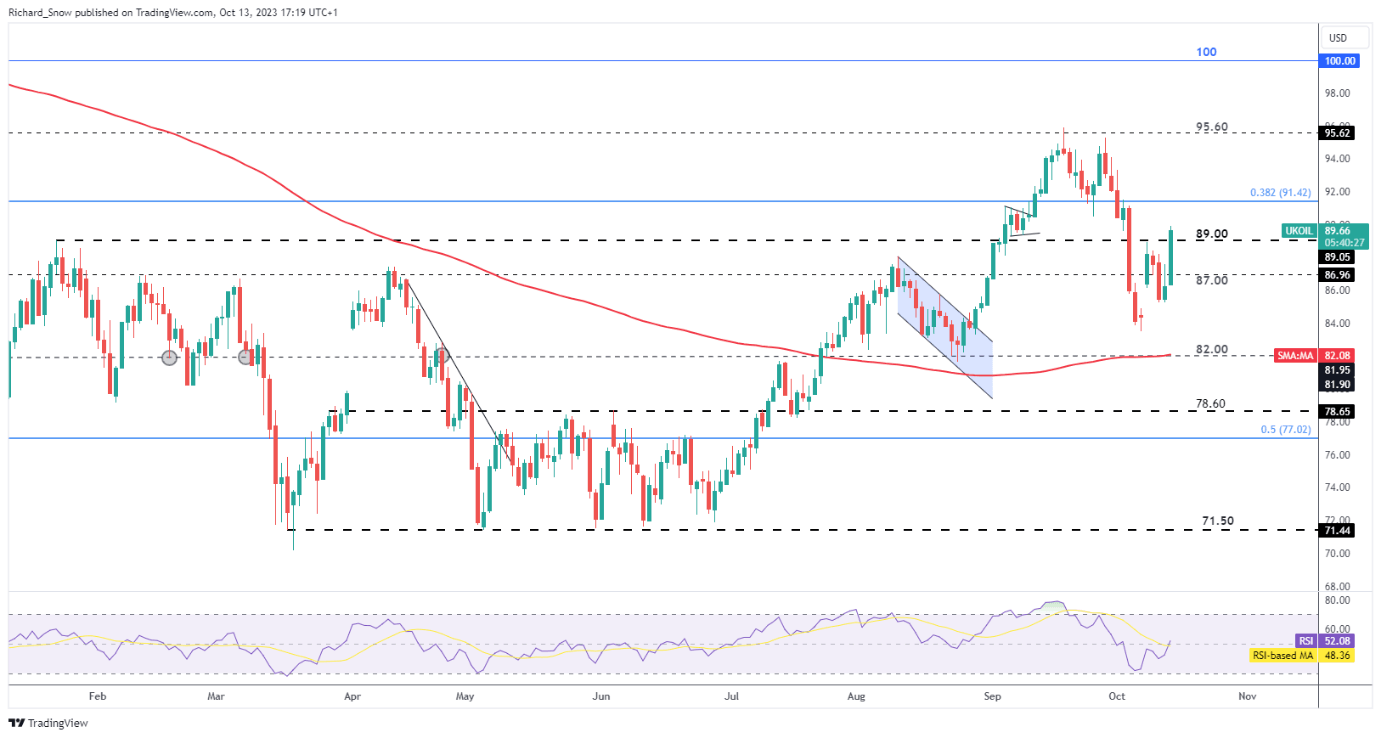
Source: TradingView, prepared by Richard Snow
WTI oil heads higher despite large EIA storage build
WTI oil found support at the $82.50 zone of prior resistance before the strong advance on Friday, surpassing the significant longer-term level around $86 which acted as a pivot point in August, September and November of last year.
Oil prices rose despite Thursday’s EIA crude storage figures which revealed massive additions to existing stock. The immediate level of resistance appears via the recent level of support (now resistance) at $88, followed by a possible retest of the swing high of $93.
WTI Crude Oil Daily Chart

Source: TradingView, prepared by Richard Snow
See what oil has in store for the final quarter of the year by reading our analyst guide below:

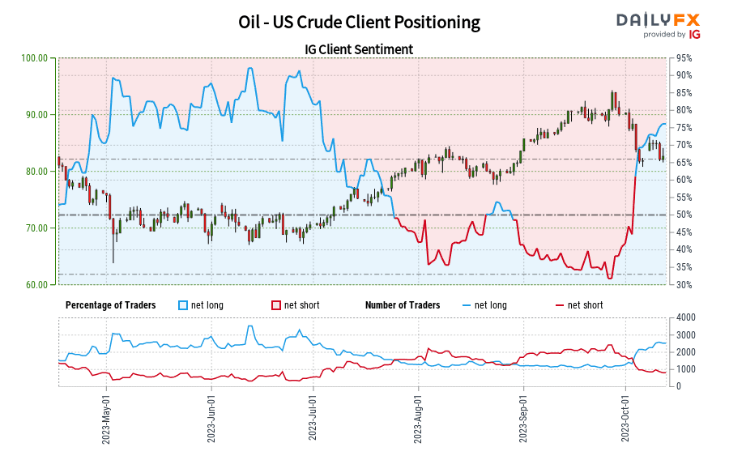
Source: IG, DailyFX, prepared by Richard Snow
Oil - US Crude: Retail trader data shows 66.32% of traders are net-long with the ratio of traders long to short at 1.97 to 1.
We typically take a contrarian view to crowd sentiment, and the fact traders are net-long suggests Oil - US Crude prices may continue to fall.
Recent changes in sentiment warn that the current Oil - US Crude price trend may soon reverse higher despite the fact traders remain net-long.
Find out why daily and weekly changes in sentiment can influence a trading bias by reading our dedicated guide on the contrarian indicator below:
| Change in | Longs | Shorts | OI |
| Daily | 1% | 0% | 1% |
| Weekly | 28% | -32% | 7% |
--- Written by Richard Snow for DailyFX.com
Contact and follow Richard on Twitter: @RichardSnowFX


