


EUR/USD Technical Forecast
See Our latest trading guides for free and discover what is likely to move the markets through Q4 of this year.
EUR/USD – Weaker Bearish Momentum
Yesterday, EUR/USD declined to 1.0989 – its lowest level in five weeks. However, the price rallied after and settled above 1.1000 handle.
Since the start of this week, the Relative Strength Index (RSI) has remained nearly flat below 50, reflecting a slowing downtrend move.
Having trouble with your trading strategy? Need a hand? Here’s the #1 Mistake That Traders Make
EUR/USD Daily PRice CHART (Mar 31, 2017 – Nov 15, 2019) Zoomed Out

EUR/USD Daily Price CHART (May 22 – Nov 15, 2019) Zoomed in
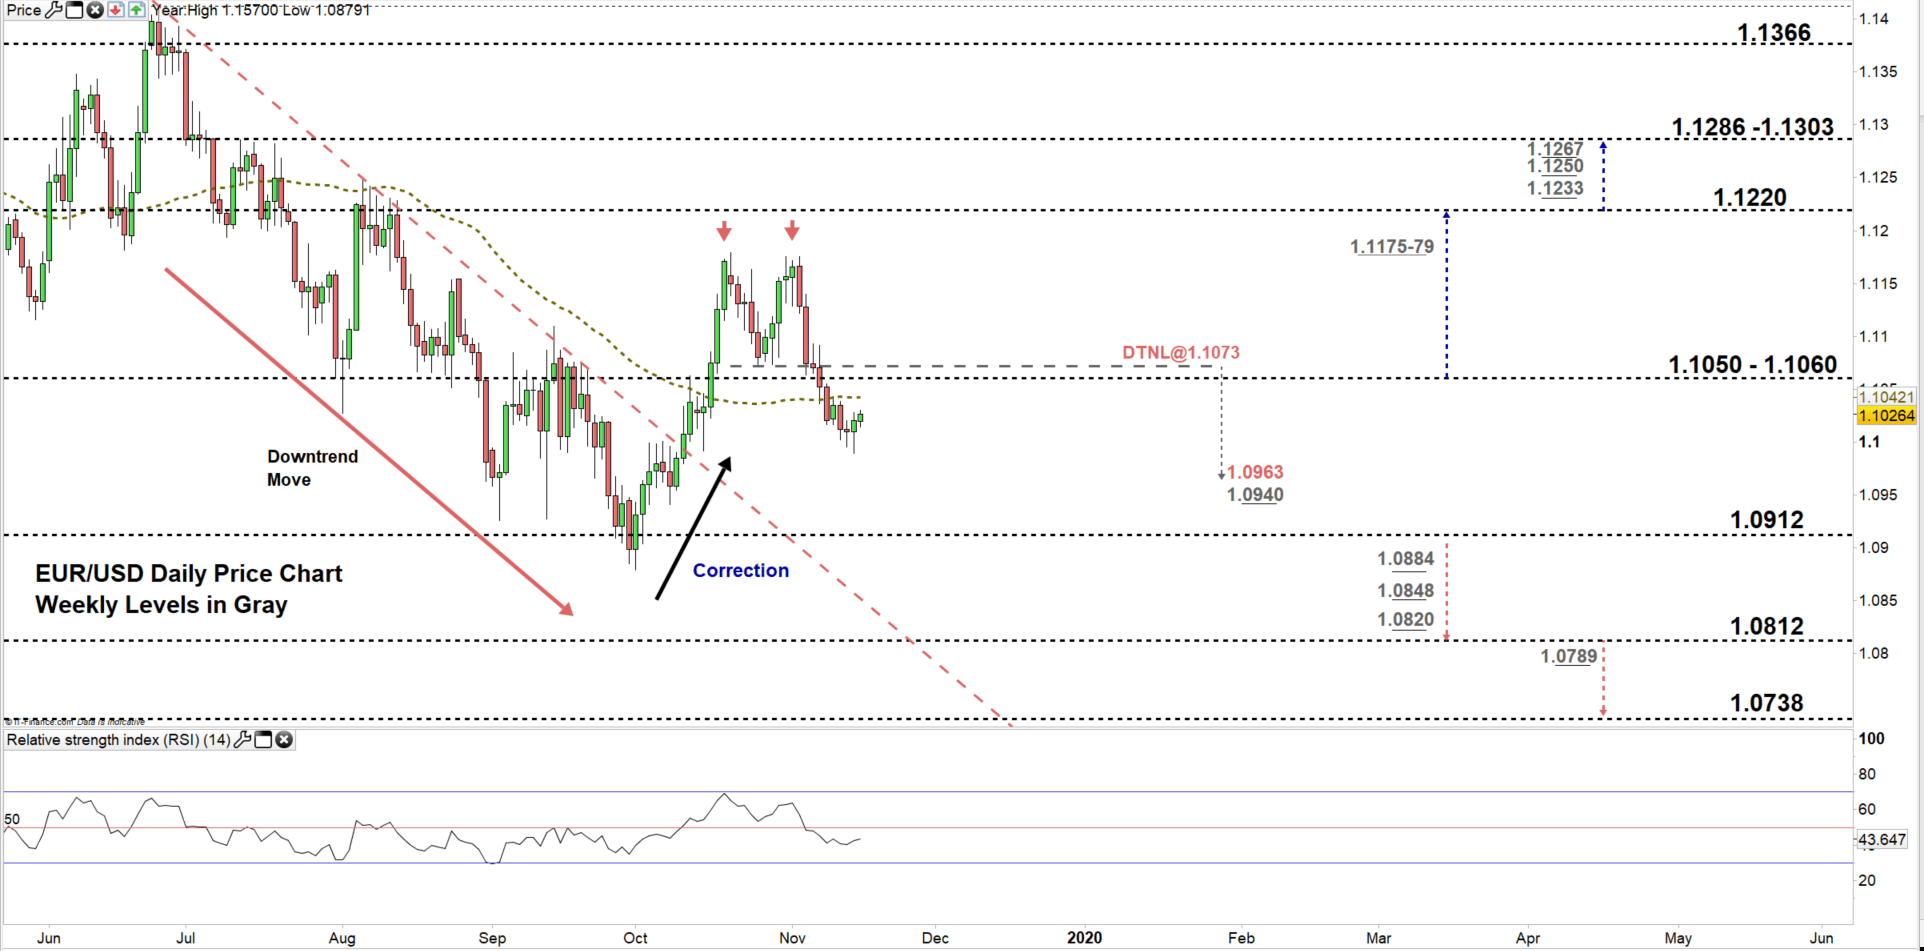
Looking at the daily chart, we notice last week EUR/USD declined to a lower trading zone 1.0912 – 1.1050, then broke below the 50-day average looking for a test of the low end of the zone.
Thus, a close below the low end of the zone could see EURUSD trading even lower towards 1.0812. However, the weekly support levels underscored on the chart (zoomed in) should be watched closely.
That said, any close above 1.1173 would negate the double top pattern highlighting seller’s pullout of the market. This may open the door for buyers to lead the price towards 1.1220. In that scenario, the weekly resistance area marked on the chart should be kept in focus.
Just getting started? See our Beginners’ Guide for FX traders
EUR/USD four Hour Price CHART (SEp 26 – Nov 15, 2019)
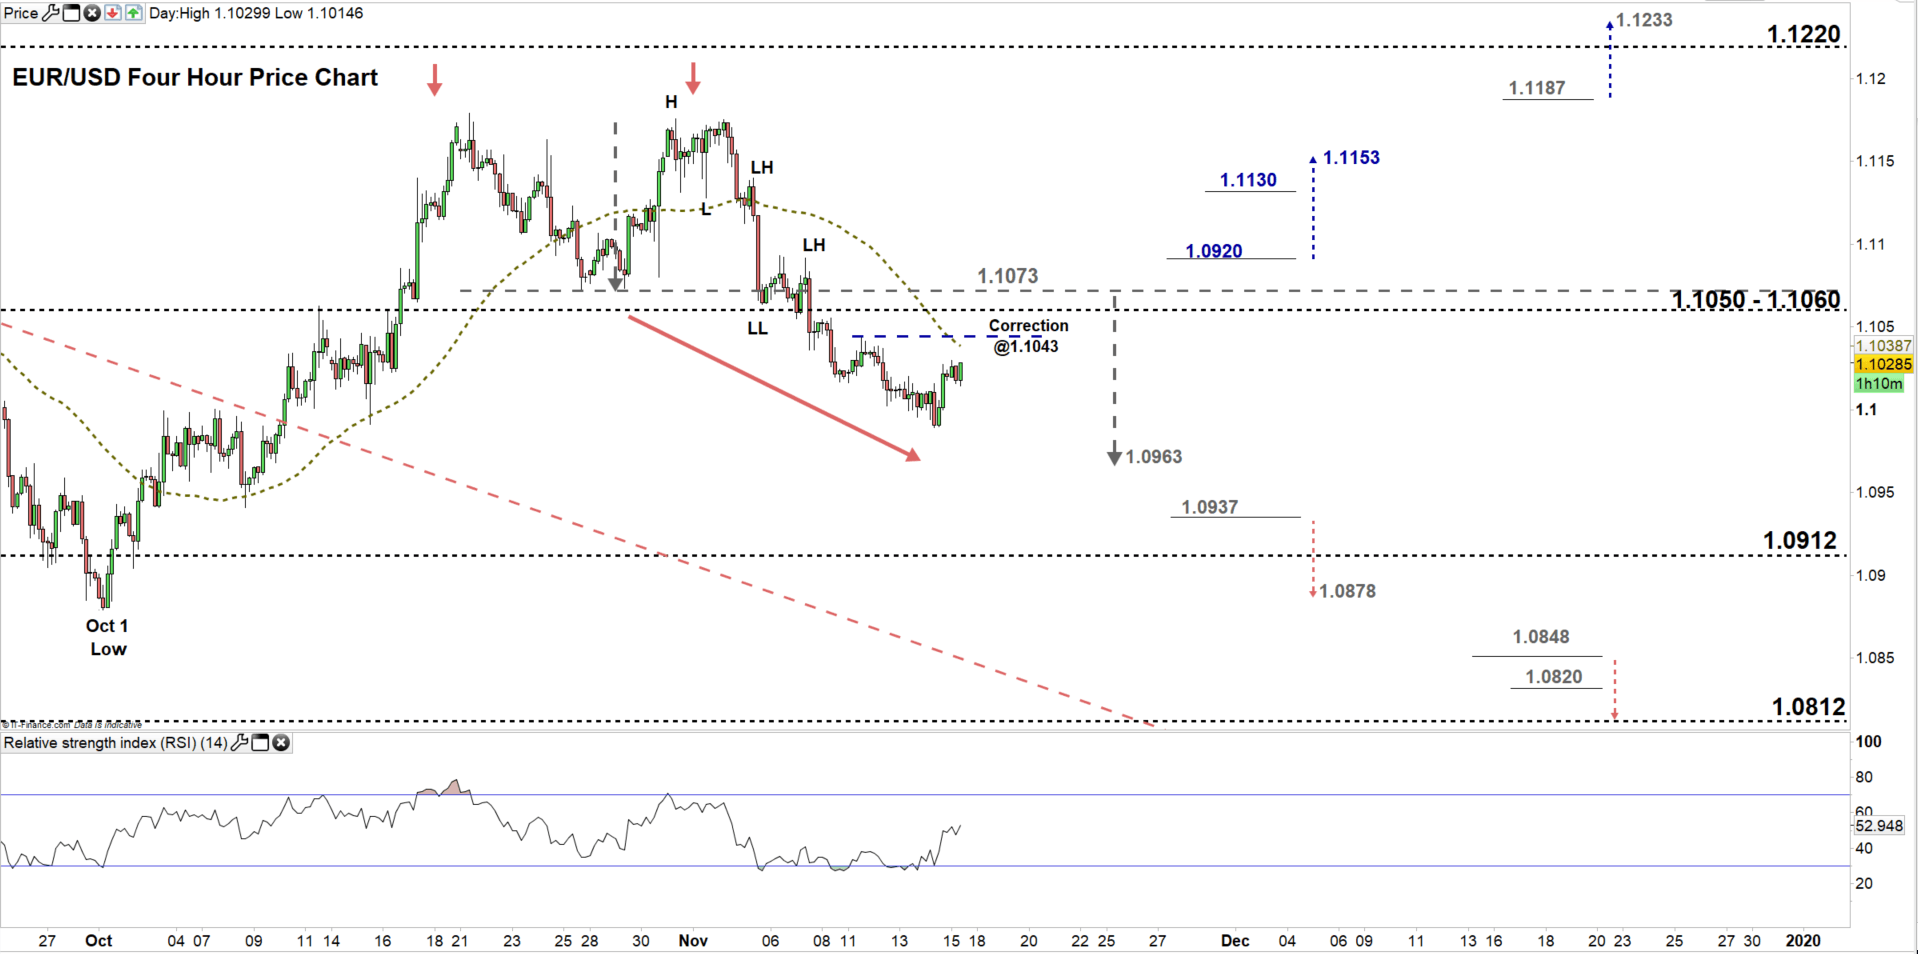
From the four-hour chart, we notice in Nov 7 EUR/USD broke below 1.1073 eyeing a test of 1.0963. Yesterday, the price dropped to its lowest since Oct 10 then rallied after, as sellers took profit. The price may correct higher if breaks above 1.1043.
Hence, a break above 1.0920 could cause a rally towards 1.1153. Nevertheless, the daily resistance level underlined on the chart should be considered. In turn, a break below 1.0937 could send EURUSD towards 1.0878. Although, the low end of the aforementioned trading zone discussed on the daily chart should be monitored.
See the chart to know more about key levels the price would encounter in a further bullish/ bearish move.
Written By: Mahmoud Alkudsi
Please feel free to contact me on Twitter: @Malkudsi


