
GBP price, news and analysis:
- GBP/USD has broken below support from a trendline connecting the higher lows of an upward sloping channel in place since March 2020.
- That leaves a key question: is this the start of a new trend lower in the pair or will strength resume once the markets have digested a surprisingly hawkish Federal Reserve.
Start of a new downtrend in GBP/USD?
GBP/USD has dropped to its lowest level since May 7, falling below 1.40 from a recent high above 1.42 in what looks to be the end of the uptrend in place for more than two years as the weekly chart below shows. This comes in the wake of a surprisingly hawkish Federal Open Market Committee that suggested US interest rates will rise faster than previously expected, with its so-called dot plot pointing to two increases by the end of 2023.
GBP/USD Price Chart, Weekly Timeframe (February 3, 2020 – June 17, 2021)
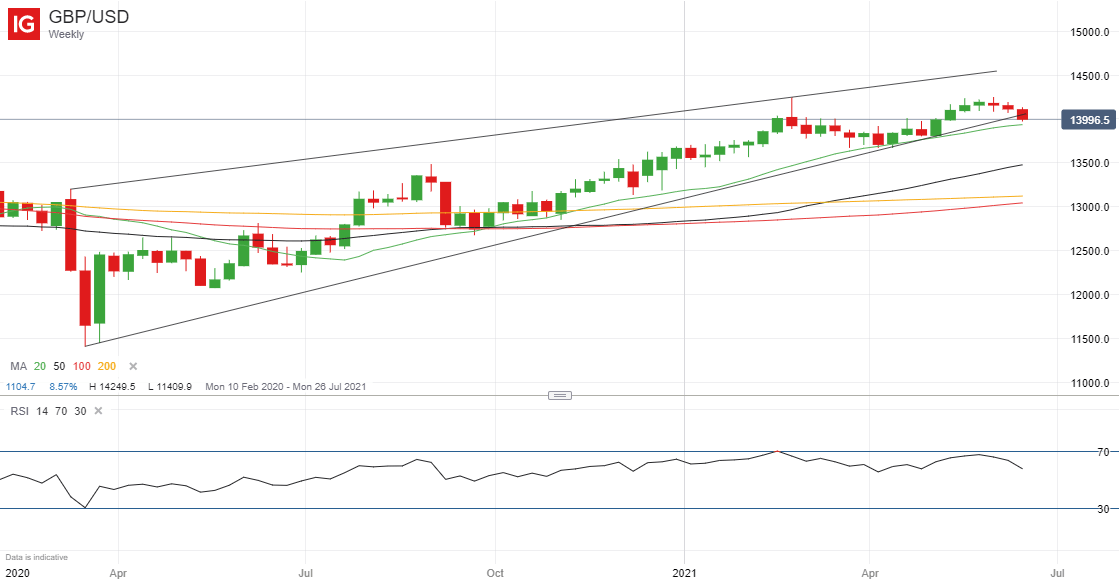
Source: IG (You can click on it for a larger image)

That leaves open one key question for GBP/USD traders: has the uptrend now ended and does this mark the start of a new trend lower, or will the price now stabilize before resuming its advance? Much will depend on whether Federal Reserve Chair Jay Powell and his colleagues push back against the hawkish message from the dot plot, or whether higher inflation data in the months ahead will reinforce the view that rates need to rise, with higher inflation no longer seen as transitory.
GBP/USD Price Chart, Daily Timeframe (March 26 – June 17, 2021)
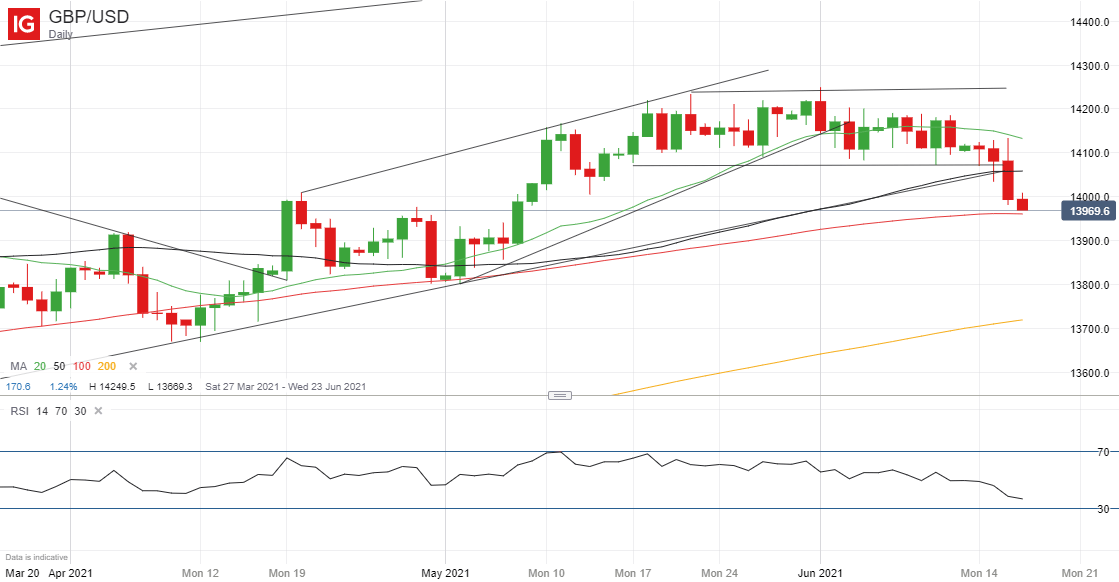
Source: IG (You can click on it for a larger image

As ever, the break will need to be sustained before a new trend lower is confirmed but, with the US Dollar recording its strongest day in 15 months after the Fed statement, EUR/USD recording its sharpest fall since November 2020 and USD/JPY testing its 2021 high, the outlook is ominous for GBP/USD bulls.
Note too that the usual Summer lull is approaching, potentially reducing volumes and leading to choppy trading in the markets overall, reinforcing the need for tight stops when trading.
| Change in | Longs | Shorts | OI |
| Daily | -9% | 6% | 0% |
| Weekly | -31% | 36% | -2% |
--- Written by Martin Essex, Analyst
Feel free to contact me on Twitter @MartinSEssex