Talking Points:
- AUD/USD Pulls Back From Fresh Monthly High; Retail FX Remains Short Ahead Australia Wage Report.
- USDOLLAR Bullish Trigger Emerges Ahead of Fed Rhetoric.
For more updates, sign up for David's e-mail distribution list.

Chart - Created Using FXCM Marketscope 2.0
- Even though AUD/USD falls back from a fresh monthly high (0.7258), the pair may continue to retrace the decline from decline from December as long as the Relative Strength Index (RSI) retains the bullish formation from earlier this year.
- With Australia’s Wage Price Index anticipated to show sticky household earnings in the fourth-quarter of 2015, a positive development may boost the appeal of the higher-yielding currency as it encourages the Reserve Bank of Australia (RBA) to retain its current policy in 2016.
- Will keep a close eye on the broad range from 2015, with key resistance coming in around 0.7380 (50% retracement) to 0.7390 (78.6% expansion).
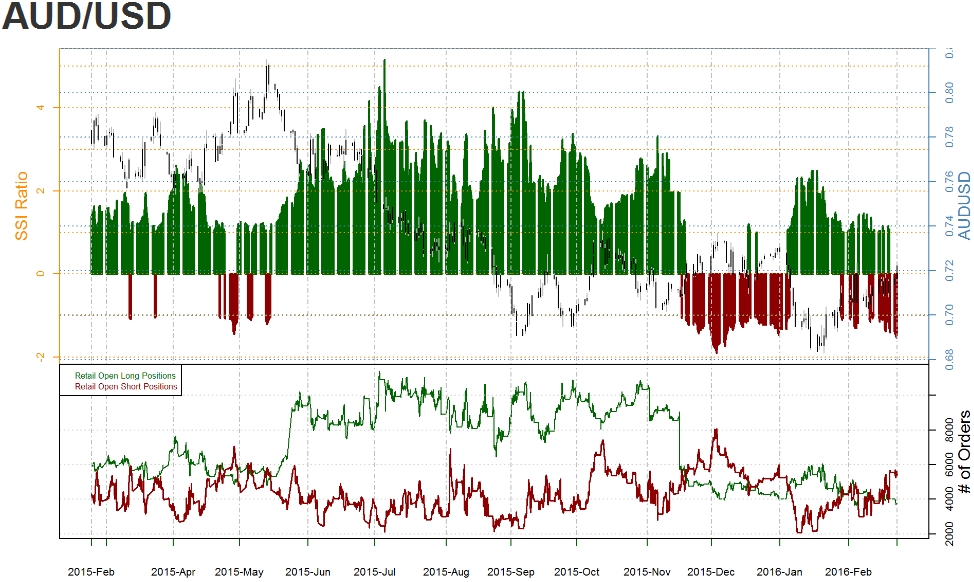
- The DailyFX Speculative Sentiment Index (SSI) shows an ongoing shift in retail positioning as FX traders remains net-short AUD/USD since February 19.
- Despite making fresh monthly highs, the retail FX crowd appears to be fading the near-term advance in AUD/USD as the ratio currently sits at -1.34, with short positions 40.7% higher from the previous week.
Why and how do we use the SSI in trading? View our video and download the free indicator here
Join DailyFX on Demand for Real-Time SSI Updates Across the Majors!
USDOLLAR(Ticker: USDollar):
| Index | Last | High | Low | Daily Change (%) | Daily Range (% of ATR) |
|---|---|---|---|---|---|
| DJ-FXCM Dollar Index | 12116.96 | 12120.85 | 12082.72 | 0.11 | 58.55% |


Chart - Created Using FXCM Marketscope 2.0
- The USDOLLAR consolidate over the next 24-hours of trade as it holds within the previous day’s range; another failed attempt to close above 12,118 (38.2% retracement) may open up the lower end of the range amid the mixed data prints that continue to come out of the world’s largest economy.
- With Fed Vice-Chair Stanley Fisherscheduled to speak on monetary policy, the fresh comments may heavily influence near-term price action as market participants continue to gauge the timing of the next rate-hike.
- Will watch the topside targets especially as the RSI appears to be breaking out of the bearish formation from earlier this year, with first region of interest coming in around 12,176 (78.6% expansion) to the 12,200 pivot.

Read More:
US Dollar – Where the Rubber Meets the Road?
EUR/USD – Bullish Views Getting Put to the Test
Constructive Copper Pattern adds to AUD/USD Intrigue
Get our top trading opportunities of 2016 HERE
Avoid the pitfalls of trading by steering clear of classic mistakes. Review these principles in the "Traits of Successful Traders" series.
--- Written by David Song, Currency Analyst
To contact David, e-mail dsong@dailyfx.com. Follow me on Twitter at @DavidJSong.
To be added to David's e-mail distribution list, please follow this link.
Trade Alongsidethe DailyFX Team on DailyFX on Demand