


Article Summary: Todays price action has left many short term scalpers confused on the direction of the USDJPY. Find out if there has been a change in the trend using momentum analysis.
Prior to today’s decline, the USDJPY was seen making steady gains toward higher highs. Even though the pair has advanced as much as 707 pips over the past three weeks, today’s decline has many short term scalpers believing that a larger turn in the market is inevitable. One way to find out is through utilizing a series of momentum analysis techniques. So has the USDJPY turned?
To identify a conclusive answer, today we will focus on how to identify short term momentum for scalpers.
Learn Forex –USDJPY Daily Trend
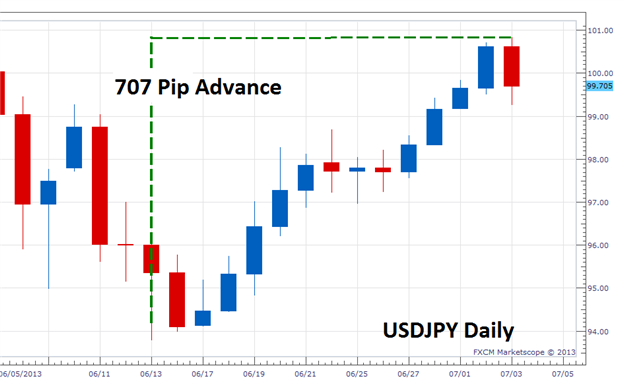
(Created using FXCM’s Marketscope 2.0 charts)
After a trend reversal, short term Forex scalpers will want to ensure that price direction has indeed picked a new singular direction. Traders will take these steps to potentially avoid trading into a false breakout while fighting longer term market momentum. One way to identify new short term momentum is to divide the previous week’s trading into two distinct pricing blocks. The key to this analysis is to ensure that price is moving in one direction and to identify any points where the chart may differ from the established long term trend. Let’s take a closer look at our example, the USDJPY.
Below we can see the current USDJPY 30min chart, divided into two pricing blocks. Block One is formed from last Wednesday the 26th through Sunday the 30th. During this period we can see the strength of the USDJPY uptrend continue as the pair moved to new highs at 99.43. This advance was immediately followed by another high created in Block 2. Normally a new set of higher highs is to be expected in a strong up trend. So let’s see how this relates to current price action and find out if our trend has turned with today’s drop in price.
Learn Forex –EURUSD Trading Blocks

(Created using FXCM’s Marketscope 2.0 charts)
In the graph above it should be noted that the Block 2 low ended at 99.15. Even though price has declined as much as 160 pips today, price did not drop below this point. In the absence of a new lower low, short term traders should consider today’s price action a new higher low on the graph. This is symbolic because it implies that at least for the present, the USDJPY’s current uptrend still stands. This will allow short term traders continue a bias to buy the USDJPY.
---Written by Walker England, Trading Instructor
To contact Walker, email instructor@dailyfx.com. Follow me on Twitter @WEnglandFX.
To be added to Walker’s e-mail distribution list, CLICK HERE and enter in your email information.
New to the FX market? Save hours in figuring out what FOREX trading is all about.
Take this free 20 minute “New to FX” course presented by DailyFX Education. In the course, you will learn about the basics of a FOREX transaction, what leverage is, and how to determine an appropriate amount of leverage for your trading.
Register HERE to start your FOREX learning now!


