
US Dollar Index (DXY) Price Value Chart Today

USDOLLAR
 7h
7h
Last updated:
Apr 19, 2024
| Low | |
| High |
Average True Range
Total Intraday Range (% of ATR)
Note: Low and High figures are for the trading day.
The US Dollar Index, also known as DXY, is used by traders seeking a measure of the value of USD against a basket of currencies used by US trade partners. The index will rise if the Dollar strengthens against these currencies and will fall if the Dollar weakens against these currencies. Plan your technical analysis of the US Dollar Index by tracking its price in the chart and keep up with the latest market movements with news, advice pieces, and the dollar index forecast.
Advertisement
News & Analysis

US Dollar Still on Bullish Path; Setups on EUR/USD, GBP/USD, USD/JPY, USD/CAD
2024-04-17 23:00:00

US Dollar Gains as Powell Turns Hawkish; Setups on EUR/USD, USD/JPY, GBP/USD
2024-04-16 20:30:00

US Dollar Soars after US CPI Data; USD/JPY Stages Bullish Breakout. What Now?
2024-04-10 20:30:00
US Inflation Preview: US Dollar & Stocks on Edge. How to Trade this Risk Event?
2024-04-10 00:00:00
FOMC Minutes: Strategies to Trade USD FX Pairs and Gold
2024-04-09 22:00:00
US Dollar Outlook & Sentiment Analysis: EUR/USD, GBP/USD, USD/CHF
2024-04-09 19:45:00
US Dollar Retreats Ahead of US CPI, Treasuries Seen Rising
2024-04-09 08:17:09
Real Time News

Apr 19, 2024
Follow
Further your trading knowledge and gain informed market analyses from our expert analyst on Oil with our free Q2 trading guide available today. https://t.co/6UqEVYOqb1 https://t.co/75m568DxRD

Apr 17, 2024
Follow
The outlook for the U.S. dollar in Q2 is cautiously optimistic, buoyed by its status as a safe haven and positive interest rate differentials against G7/G10 currencies.
Get your market update here: https://t.co/sqejC2RUlh https://t.co/ejxOtnCA9M
Apr 15, 2024
Follow
Slippage can be a common occurrence in forex trading but is often misunderstood. Understanding how forex slippage occurs can enable a trader to minimize negative slippage, while potentially maximizing positive slippage. Learn about FX slippage here: https://t.co/Blrl0uF2Ct https://t.co/2JBu9dL2dx


Inflation Sets Up US Open Ahead of Company Earnings
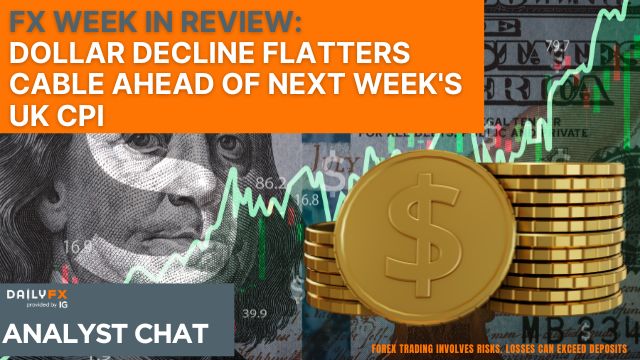
Dollar Decline Flatters Cable Ahead of Next Week's UK CPI
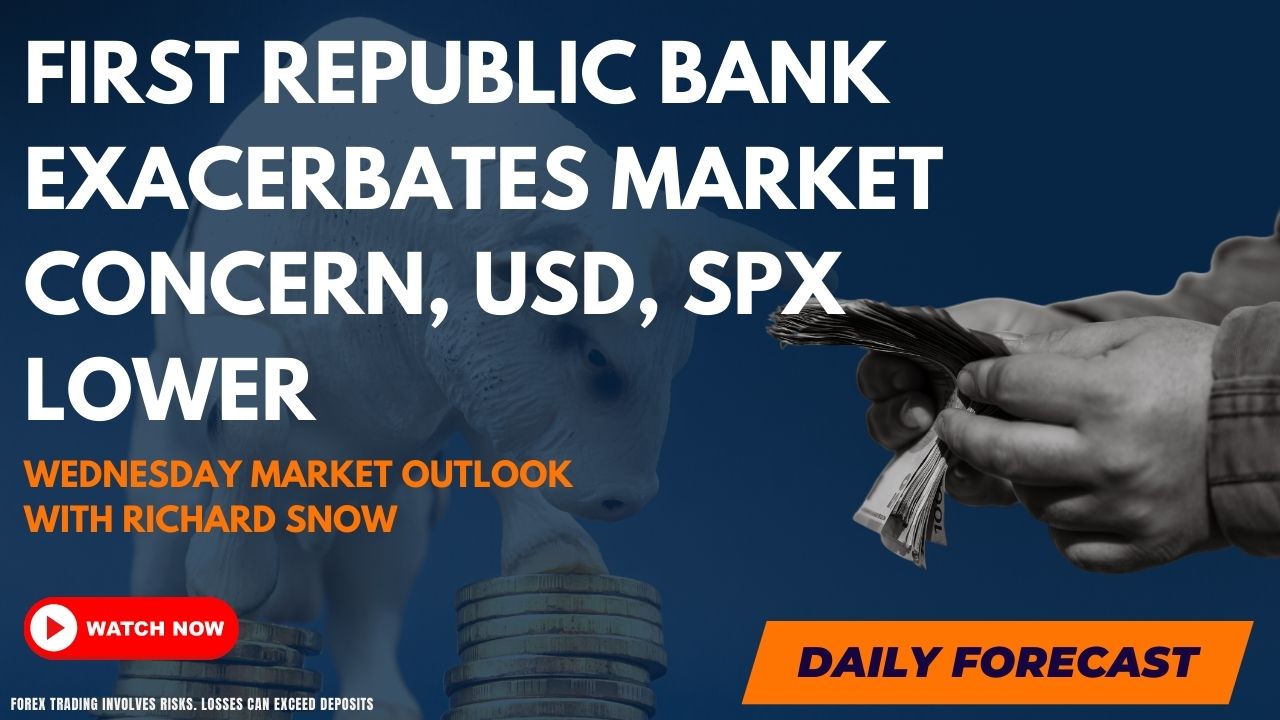
First Republic Bank Exacerbates Market Concern, USD, SPX Lower
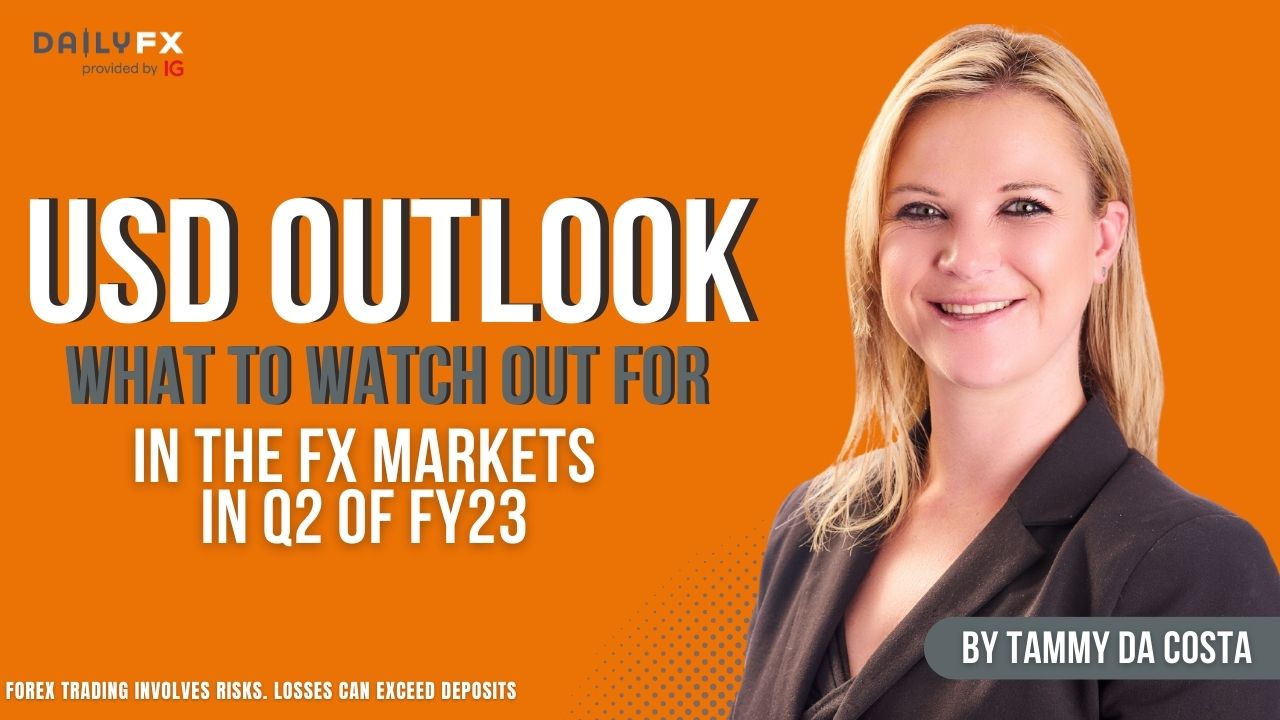
USD Outlook | What to Watch Out For In The Markets

The US National Debt Clock is Ticking – Why People Are Now Paying Attention
US Debt Ceiling: a Distraction and a Warning
Advertisement