


GOLD PRICES OUTLOOK:
- Gold prices extend their rebound after encountering support at the lower limit of a medium-term ascending channel
- Gold’s technical profile remains constructive, but the fundamental outlook is becoming less benign
- This article looks at XAU/USD’s key levels to watch in the coming trading sessions

Most Read: Gold Price Forecast - Dreams of Fresh Record Shattered for Now as Bears Pounce
Gold prices extended their recovery on Tuesday, up about 0.1% to $1,963, rising for a second consecutive session after a sharp sell-off last Friday, but gains were limited as deep-pocket traders continued to avoid large directional positions amid uncertainty over the Federal Reserve’s policy outlook.
In the grand scheme of things, U.S. Treasury yields have charged higher in recent weeks, prolonging their solid rebound that began in early May in response to the hawkish repricing of the Fed’s tightening path. These dynamics have created headwinds for non-yielding assets, leading to a correction in the space.
For gold and other precious metals to reassert durable strength in financial markets, nominal and real yields will have to retreat from current levels, but this may be a difficult feat so long as the economy remains resilient, and the FOMC maintains its resolve to bring inflation back to 2.0%.
Focusing on the Fed, policymakers have signaled that they may hold rates steady this month to better assess the lagged effects of past actions, but this should not be interpreted as a protracted pause, as the hiking cycle could resume in July given sticky price pressures in the country. This poses a risk to gold.
Related: How to Trade Gold - Top Gold Trading Strategies and Tips
| Change in | Longs | Shorts | OI |
| Daily | -2% | 7% | 2% |
| Weekly | 6% | -11% | -3% |
GOLD TECHNICAL ANALYSIS
From a technical perspective, gold remains biased to the upside despite the recent weakness, with prices retaining the sequence of higher highs and higher lows and trading within the confines of a medium-term ascending channel, as seen in the daily chart below.
Following the latest downward correction, XAU/USD tested the lower boundary of the channel on several occasions, but was repelled higher every single time. The rejections, however, have lacked force and momentum, a sign that bulls are struggling to assert themselves.
For near-term directional cues, traders should watch how prices evolve and react in the coming days. That said, there are two possible scenarios worth discussing: 1) a break below $1,950 and a push above overhead resistance near $1,975.
Scenario #1: If gold reverses to the downside and breaches support around $1,950, selling pressure could gather pace, setting the stage for a slump toward $1,895, the 38.2% Fib retracement of the September 2022-May 2023 rally. On further weakness, the focus would shift to $1,875.
Scenario #2: If bulls manage to drive prices higher and clear resistance at $1,975 decisively, sentiment around the metal could improve, attracting new buyers into the market and creating the right conditions for a move toward the psychological $2,000 mark.
GOLD PRICES TECHNICAL CHART
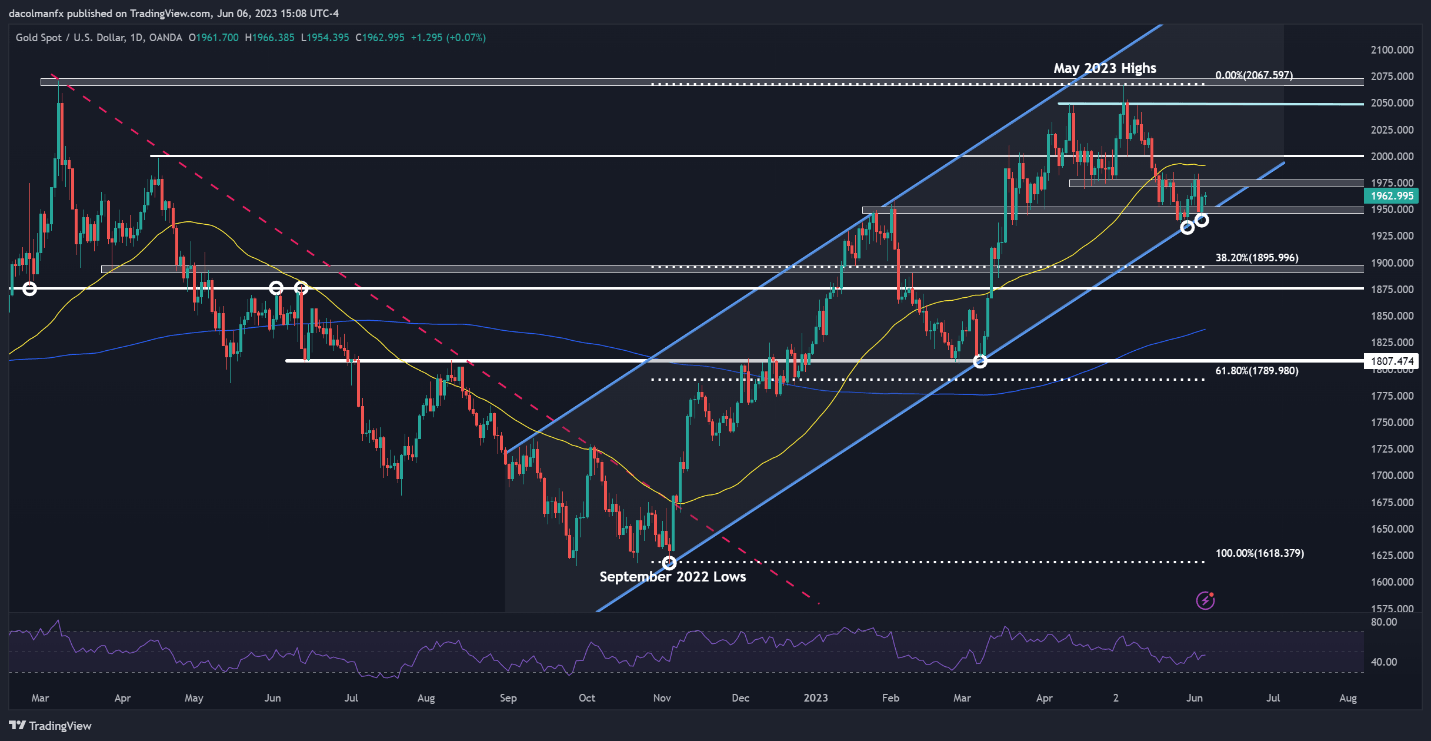
Gold Prices Chart Prepared Using TradingView


