


For most of Q1 2023 WTI crude oil prices oscillated between two very crucial levels as traders attempted to gauge the longer-term direction of the commodity. The level of resistance at $82.50 provided a solid ceiling, while the upper band of the $67 - $72 target zone to replenish SPR supplies provided support for most of the quarter, until we saw a late push, deeper into the target range, towards $67 where prices struggled to achieve a daily close below that level. While this article concentrates on oil's technical landscape, the oil market is heavily influenced by fundamentals like demand and supply - download the full Q2 forecast below:

WTI Crude Oil (Daily Chart)
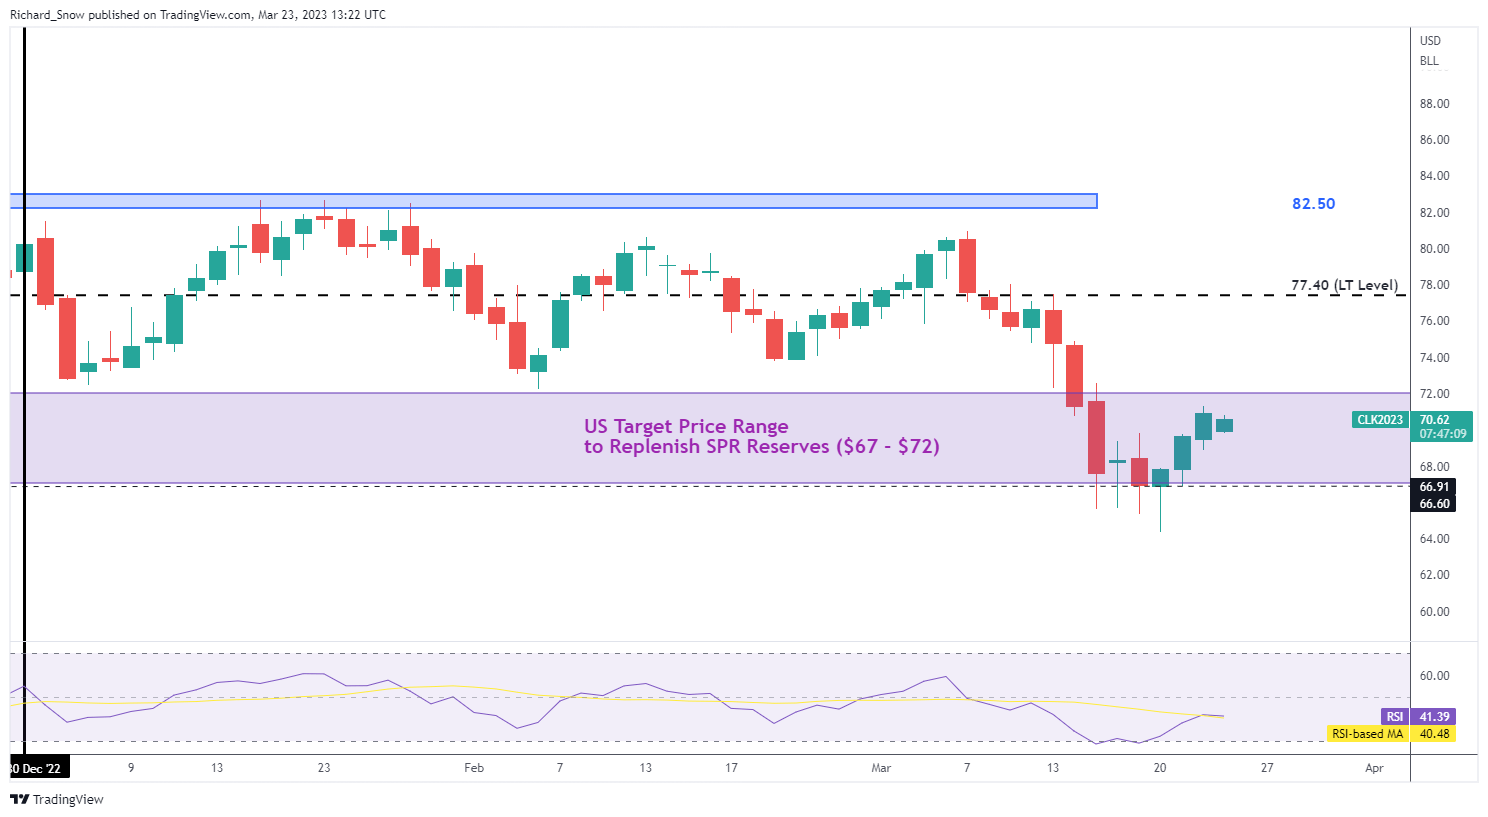
Source TradingView, chart prepared by Richard Snow, Analyst
It is beneficial to zoom out to the monthly chart to see how the price action in Q1 fits into the longer-term trend. Since the massive price spikes in Q1 2022, oil prices have essentially been in decline – much to the relief of global consumers as such a drastic rise set into motion a long period of unacceptably high inflation.
While the long-term trend is certainly a downtrend, something to note is the frequency of monthly candles exhibiting extended lower wicks, possibly a sign of a fatigue. Essentially, this reveals that while prices traded at the lows, there was a reluctance to stay at those levels as bulls pushed prices up – suggesting that bearish momentum may fade in the coming quarters of 2023 as bulls begin to see value at lower levels.
WTI Crude Oil (Monthly Chart)
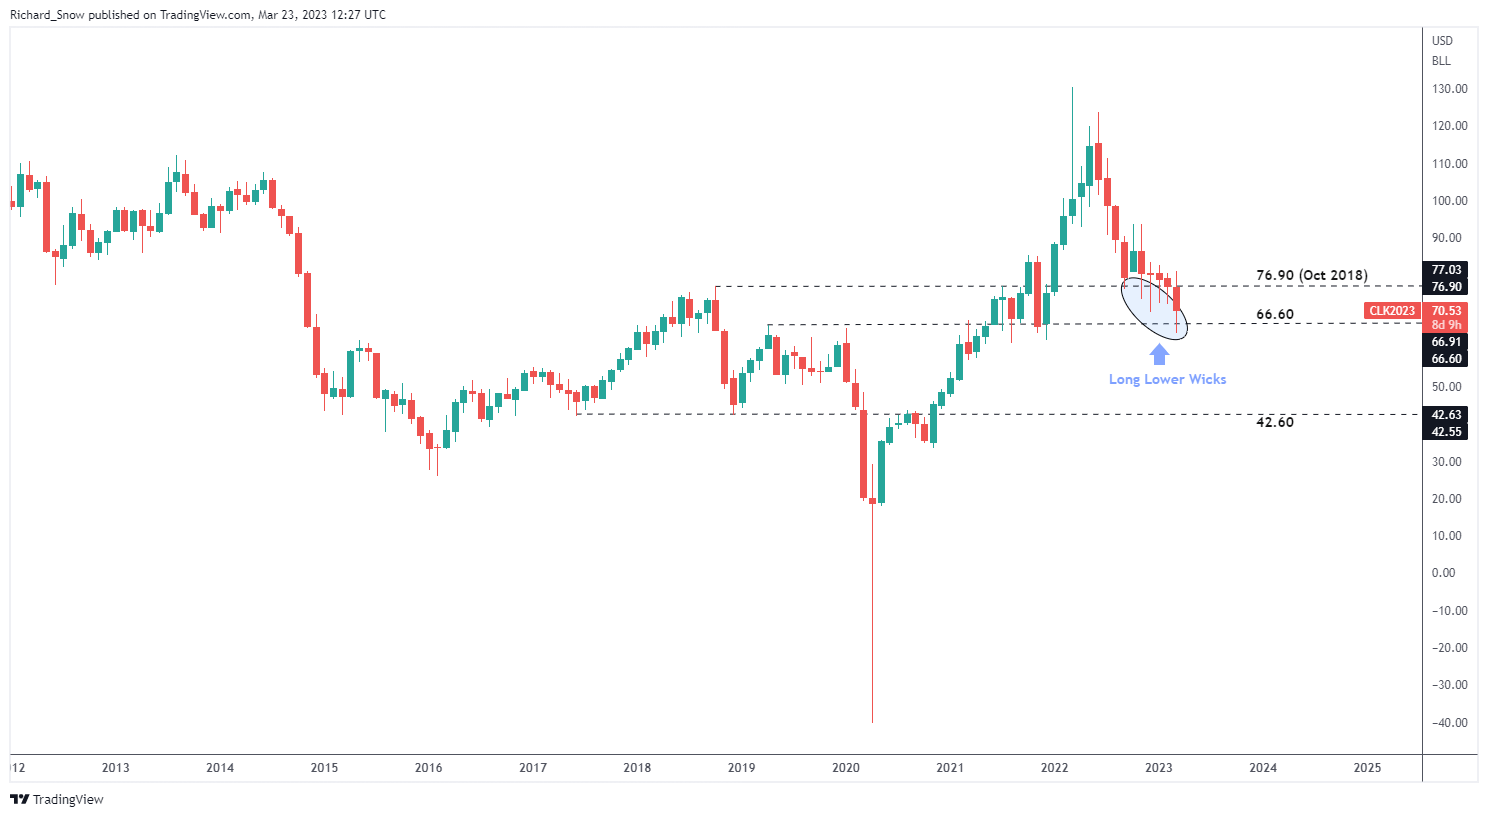
Source TradingView, chart prepared by Richard Snow, Analyst
Technical Forecast: Neutral with Bearish Potential Towards $55
The weekly WTI chart revealed what appeared to be an upside breakout, above the falling wedge. However, recent volatile price action, in response to a potential ststemic banking crisis, resulted in oil falling right back within the wedge formation where it encountered a notable zone of support.
The confluence zone in question consists of the 38.2% Fibonacci retracement of the 2020 to 2022 major move ($64.25); and the lower bound of the identified range favored by the Biden administration to refill SPR stocks at ($67). The $66.70 or roughly $67.00 level has proved to provide a pivot point for oil either as resistance, like in 2019 and 2020, or as support since 2021.
Given that there is yet to be a breakdown of the current downtrend, and we are still witnessing lower highs and lower lows, the guidance for WTI into Q2 remains tilted to the bearish side. If we see a mean reversion towards levels seen before the large bank-induced sell-off (+- $75), oil prices could re-enter the channel of consolidation, moving largely sideways.
However, in the absence of evidence to the contrary, the longer-term downtrend remains, opening up a move lower. A conclusive break below the $65.25 zone of confluence would suggest the next major price level becomes $50.60. The quarterly average true range sits at a typical move of $23 which has been influenced by the massive price swings since 2020 and therefore, in the absence of a global banking crisis, ought to be moderated slightly. Nevertheless, the current trend suggests that even if oil prices rise back to $75, the potential to trade above $50, around $55 remains possible.
With oil markets so inextricably linked to fundamentals like demand and supply – with supply being manipulated by major oil producers like OPEC - it remains to be seen if such a decline can persist given OPEC’s ability to rein in oil supply/output in an attempt to avoid large price declines.
WTI Crude Oil (Weekly Chart)
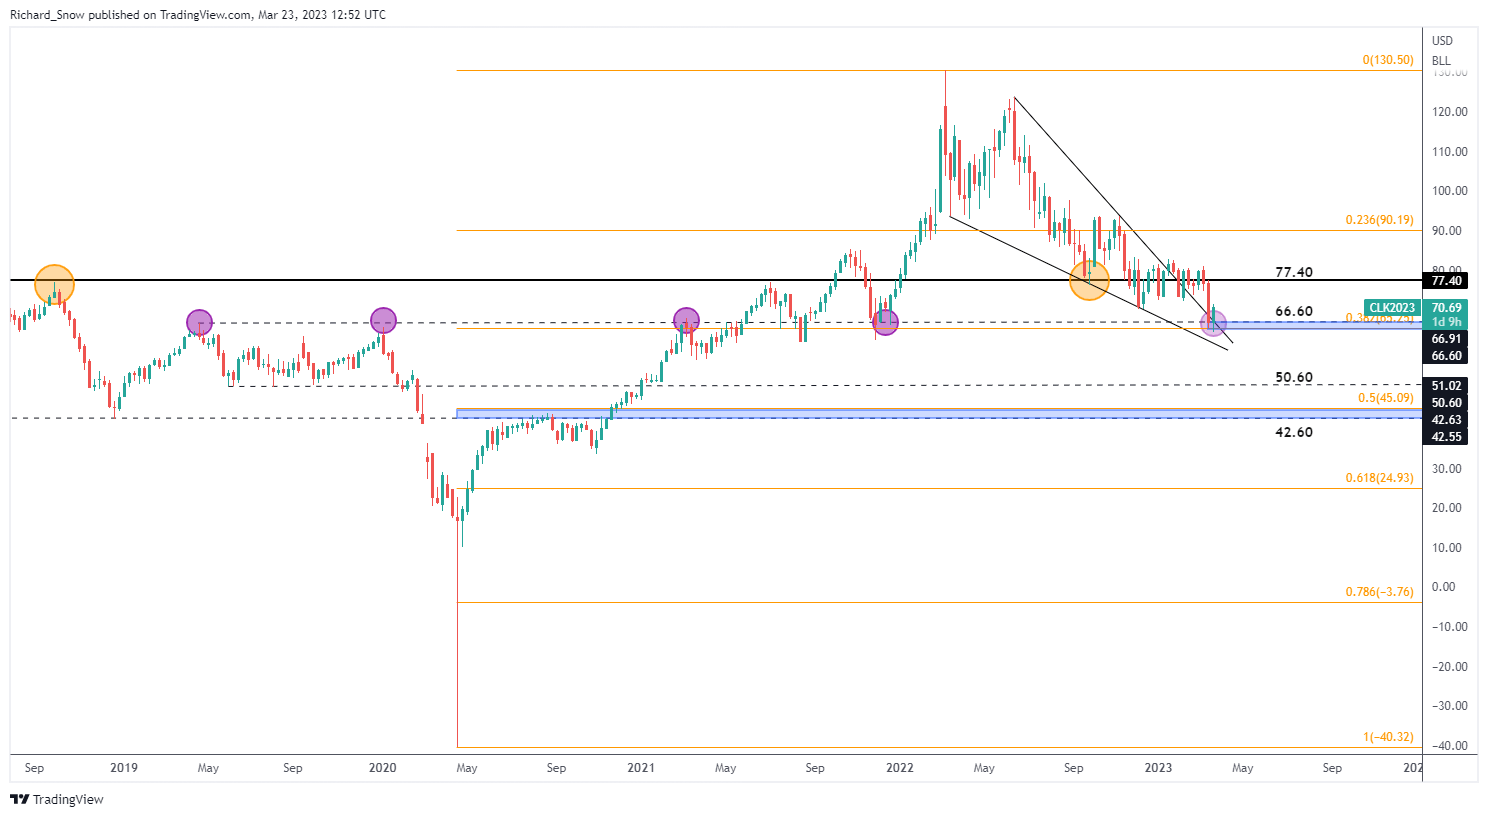
Source TradingView, chart prepared by Richard Snow, Analyst
Trade Smarter - Sign up for the DailyFX Newsletter
Stay up to date with current themes driving markets


