


- WTI Finally Back Above the Psychological $90.00/bbl Level.
- Morningstar Candlestick Pattern on the Weekly Hints at Further Upside.
- OPEC+ Will Not Hesitate to Keep Prices Supported, $100/bbl Remains in Play.

WTI Fundamental Outlook
WTI Oil rallied 17% last week on the back of OPEC+ announcing production cuts to begin in November. Saudi Arabia’s energy minister stated last week that he’s never known uncertainty like this while reiterating the need for market stability. OPEC+ have made their position clear with the recent cuts in production that they are willing to do what is necessary to keep prices stable and closer to the $100 a barrel mark. Given the announcement by OPEC+, the US are weighing the potential of dipping into their strategic petroleum reserves once more. Should the US follow through and demand concerns linger we could be in for a pullback in price before a potential rally higher toward the $100 a barrel mark. This would tie in perfectly with the technical narrative developing at the moment.
WTI Oil Weekly Chart – October 11, 2022
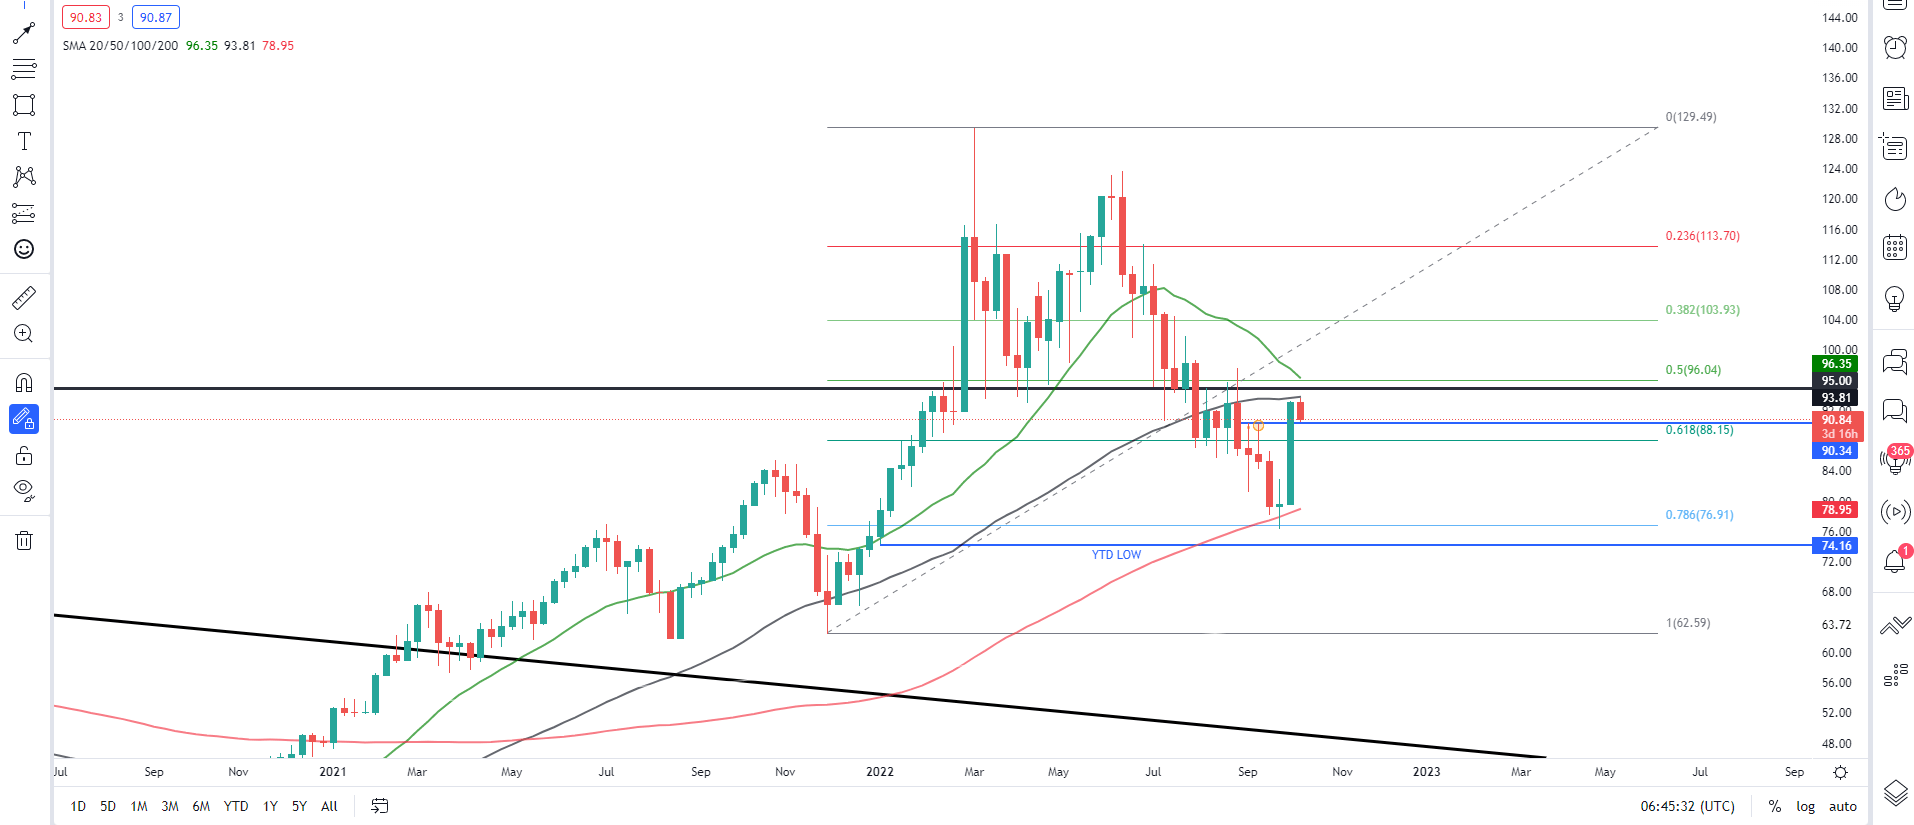
Source: TradingView
From a technical perspective, WTI on the weekly chart has printed a Morningstar candlestick pattern while closing above the key $90.00 psychological level. The weekly candle closed with barely any upside wick, a further indication of the upside momentum in play. The weekly candle has tapped into 50-SMA providing resistance which has capped gains to start the week. Given the size as well as the speed of the move there is every chance of a pullback at this stage. The better question being how deep a pullback should we expect?
WTI Oil Daily Chart – October 11, 2022
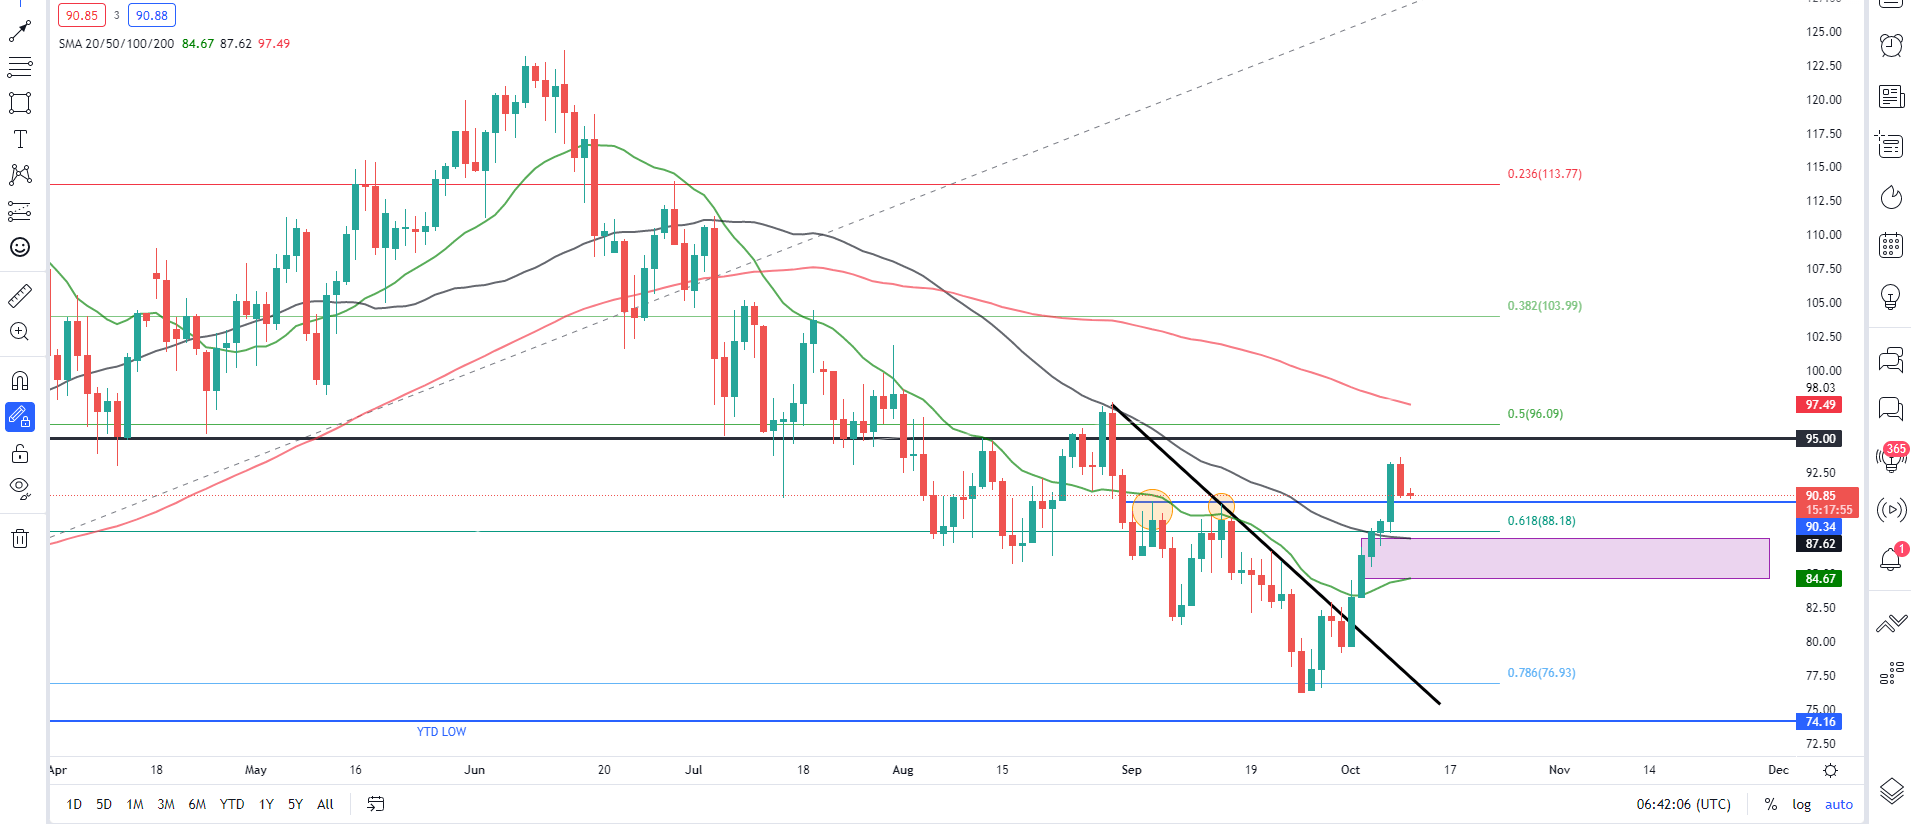
Source: TradingView
On a daily chart, WTI has broken and closed above the 20 and 50-SMA as we now trade between the $90.00 and $95.00 psychological levels. The RSI on the daily meanwhile remains in overbought territory which adds further credence to the possibility of a pullback in price.
We have a host of support areas which may come into play should price continue pushing down. The closest being the key psychological $90.00 level where price previously double-topped before declining sharply. A deeper pullback in price could lead to a retest of the 20 and 50-SMA which lines up with the 2013 and August 2022 lows around $85.00-$87.00 area. The host of confluences at play in this area only adds to the probability for bulls to step in once more with new highs around the$95.00-$100.00 area a possibility.
Trade Smarter - Sign up for the DailyFX Newsletter
Receive timely and compelling market commentary from the DailyFX team
Resources for Traders
Whether you are a new or experienced trader, we have several resources available to help you; indicators for tracking trader sentiment, quarterly trading forecasts, analytical and educational webinars held daily, trading guides to help you improve trading performance, and one specifically for those who are new to forex.
Written by: Zain Vawda, Market Writer for DailyFX.com
Contact and follow Zain on Twitter: @zvawda


