


Canadian Dollar Talking Points
USD/CAD carves a series of lower highs and lows as it extends the decline from the yearly high (1.3837), and the exchange rate may face a larger pullback over the coming days as the Relative Strength Index (RSI) falls back from overbought territory to indicate a textbook sell signal.
USD/CAD Rate Pulls Back to Generate RSI Sell Signal
USD/CAD slips to a fresh weekly low (1.3503) as the US Dollar weakens against all of its major counterparts, and the update to Canada’s Employment report may keep the exchange rate under pressure as job growth is expected to rebound in September.
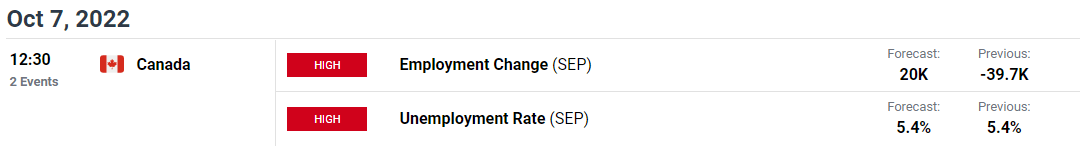
Canada employment is projected to increase 20.0K after unexpectedly contracting 39.7K in August, and an improvement in the labor market may keep the Bank of Canada (BoC) on track to further normalize monetary policy over the coming months as “the Governing Council still judges that the policy interest rate will need to rise further.”
As a result, the BoC may deliver another 75bp rate hike as the Governing Council pledges to “take action as required to achieve the 2% inflation target,” and it remains to be seen if Governor Tiff Macklem and Co. will adjust the forward guidance at the next meeting on October 26 as the central bank is slated to release the updated Monetary Policy Report (MPR).
Until then, USD/CAD may face a larger pullback as it carves a series of lower highs and lows, but fresh data prints coming out of the US may also influence the exchange rate as the Non-Farm Payrolls (NFP) report is anticipated to show a further improvement in the labor market.
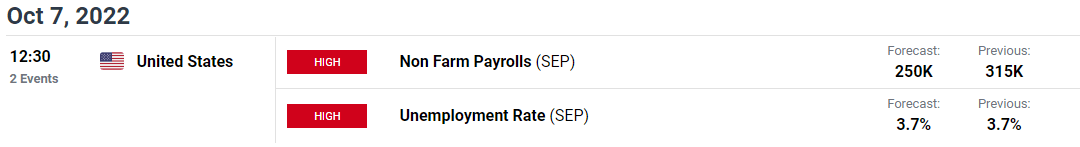
The US economy is expected to add 250K jobs in September following the 315K expansion the month prior, and the development may curb the recent decline in USD/CAD as it encourages the Federal Reserve to retain its approach in combating inflation.
In turn, USD/CAD may track the positive slope in the 50-Day SMA (1.3120) as the Federal Open Market Committee (FOMC) pursues a restrictive policy, but a larger pullback in the exchange rate may continue to alleviate the tilt in retail sentiment like the behavior seen earlier this year.
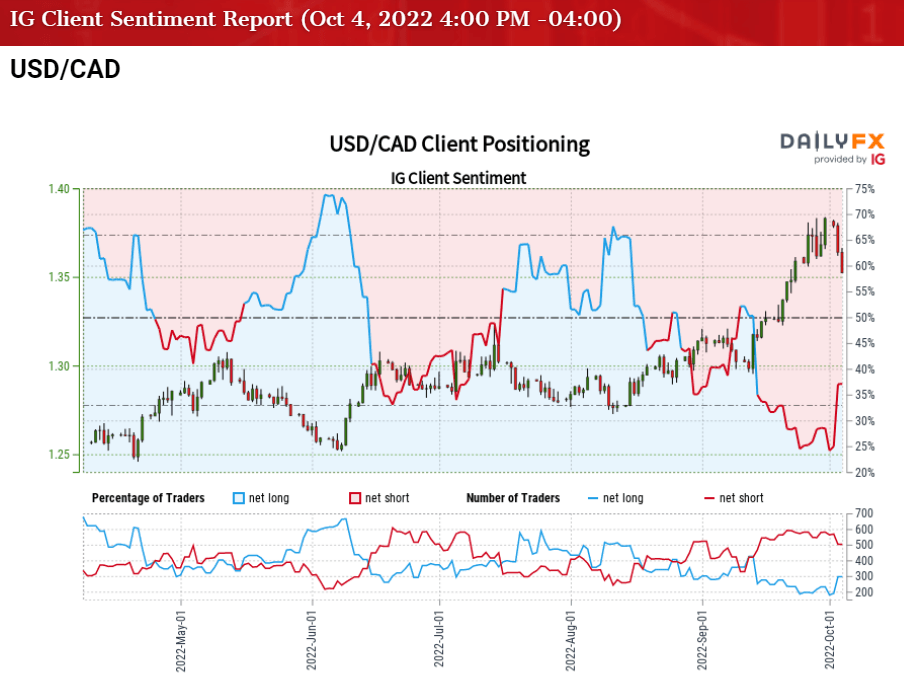
The IG Client Sentiment report shows 31.45% of traders are currently net-long USD/CAD, with the ratio of traders short to long standing at 2.18 to 1.
The number of traders net-long is 8.73% lower than yesterday and 11.56% higher from last week, while the number of traders net-short is 4.79% higher than yesterday and 0.37% higher from last week. The rise in net-long interest has helped to alleviate the crowding behavior as 29.80% of traders were net-long USD/CAD last week, while the increase in net-short position comes as USD/CAD carves a series of lower highs and lows.
With that said, USD/CAD may face a larger pullback ahead of the key data prints due out later this week as the Relative Strength Index (RSI) falls back from overbought territory, but the decline from the yearly high (1.3837) may end up being short-lived as the exchange rate appears to be tracking the positive slope in the 50-Day SMA (1.3120).
Introduction to Technical Analysis
Market Sentiment
Recommended by David Song
USD/CAD Rate Daily Chart
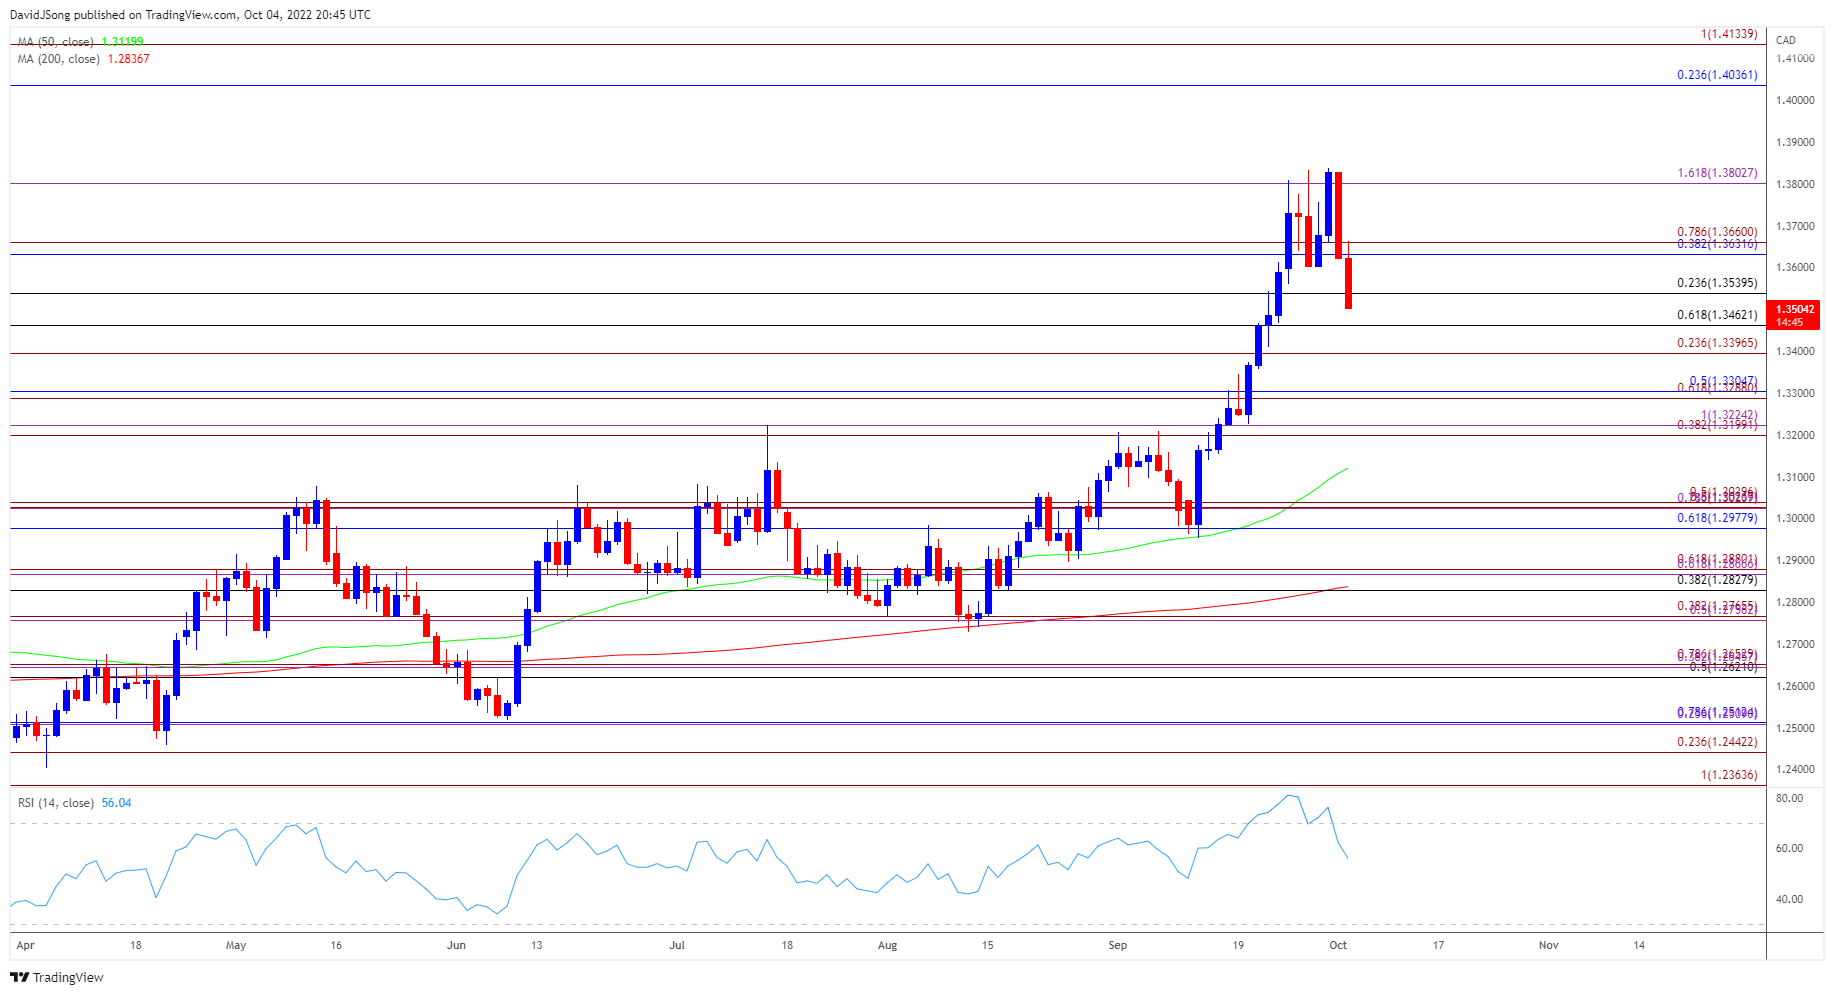
Source: Trading View
- USD/CAD extends the decline from the yearly high (1.3837) as the Relative Strength Index (RSI) falls back from overbought territory, with the recent series of lower highs and lows bringing the 1.3460 (61.8% retracement) area back on the radar.
- Next area of interest comes in around the 1.3400 (23.6% expansion) handle followed by the 1.3290 (61.8% expansion) to 1.3310 (50% retracement) region, but the former resistance zone around 1.3290 (61.8% expansion) to 1.3310 (50% retracement) may act as support as the 50-Day SMA (1.3120) reflects a positive slope.
- Need a move back above the 1.3630 (38.2% retracement) to 1.3660 (78.6% expansion) region to bring the 1.3800 (161.8% expansion) handle back on the radar, with a break above the yearly high (1.3837) opening up the 1.4040 (23.6% retracement) to 1.4130 (100% expansion) area.
Trading Strategies and Risk Management
Becoming a Better Trader
Recommended by David Song
--- Written by David Song, Currency Strategist
Follow me on Twitter at @DavidJSong


