


US Equity Futures Latest: Nasdaq, S&P Linger After as Inflation Remains Elevated
- Nasdaq 100 eases back after US CPI upside surprise
- S and P 500 (S&P) retraces, resistance holds at mid-point of 2022 move

US CPI Rattles Markets as Investors Await Fed Speak
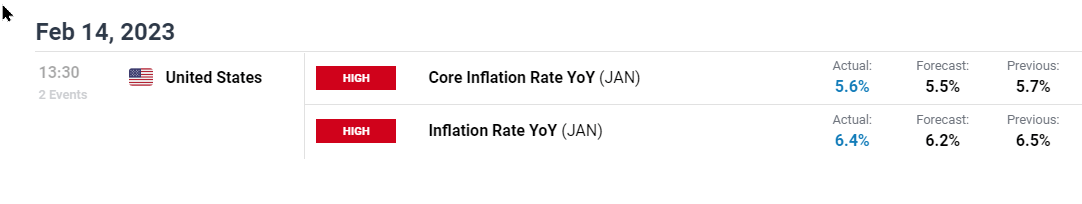
US CPI data was the focus of today’s economic calendar, setting the tone for stock indices. With January’s inflation print coming in hotter than expected, rate expectations lifted stocks before forcing risk assets lower.
With Core CPI (excluding food and energy) coming in at 5.6%, the annual inflation beat forecasts of 6.2%, rising to 6.4% last month. While the Nasdaq 100 index rose sharply upon release of the data, S$P 500 and Dow followed suite, before surrendering a portion of today’s gains.
DailyFX Economic Calendar
Nasdaq Technical Analysis
After erasing 2.02% of its value last week, a temporary move below the December high of 12339 allowed prices to trade lower, marking a new 2023 low at 12243.25.
Keep track of interest rate decisions by visiting our Central Bank Calendar
As markets opened on Monday, a rebound off this level helped facilitate the recovery that drove tech heavy Nasdaq to psychological resistance at 12600. With prices currently testing the rising trendline from the 2023 move, NDX eased before finding support around 12,461.
Nasdaq 100 Futures (Daily Chart)
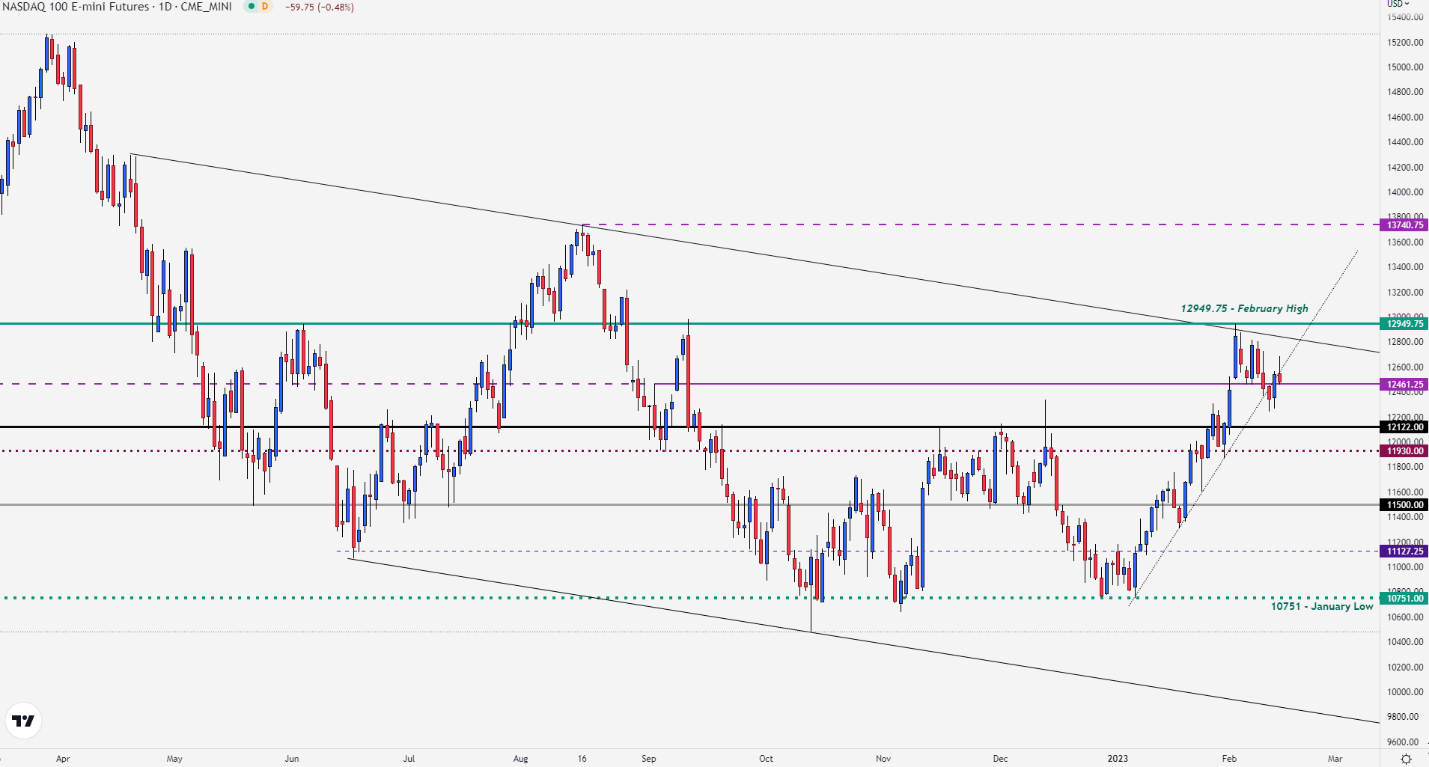
Chart prepared by Tammy Da Costa using TradingView
With S&P 500 futures rising back to the December high of 4180, a rejection at resistance drove US 500 below the mid-point of the 2022 move at 4155.
S&P 500 Chart (Daily)
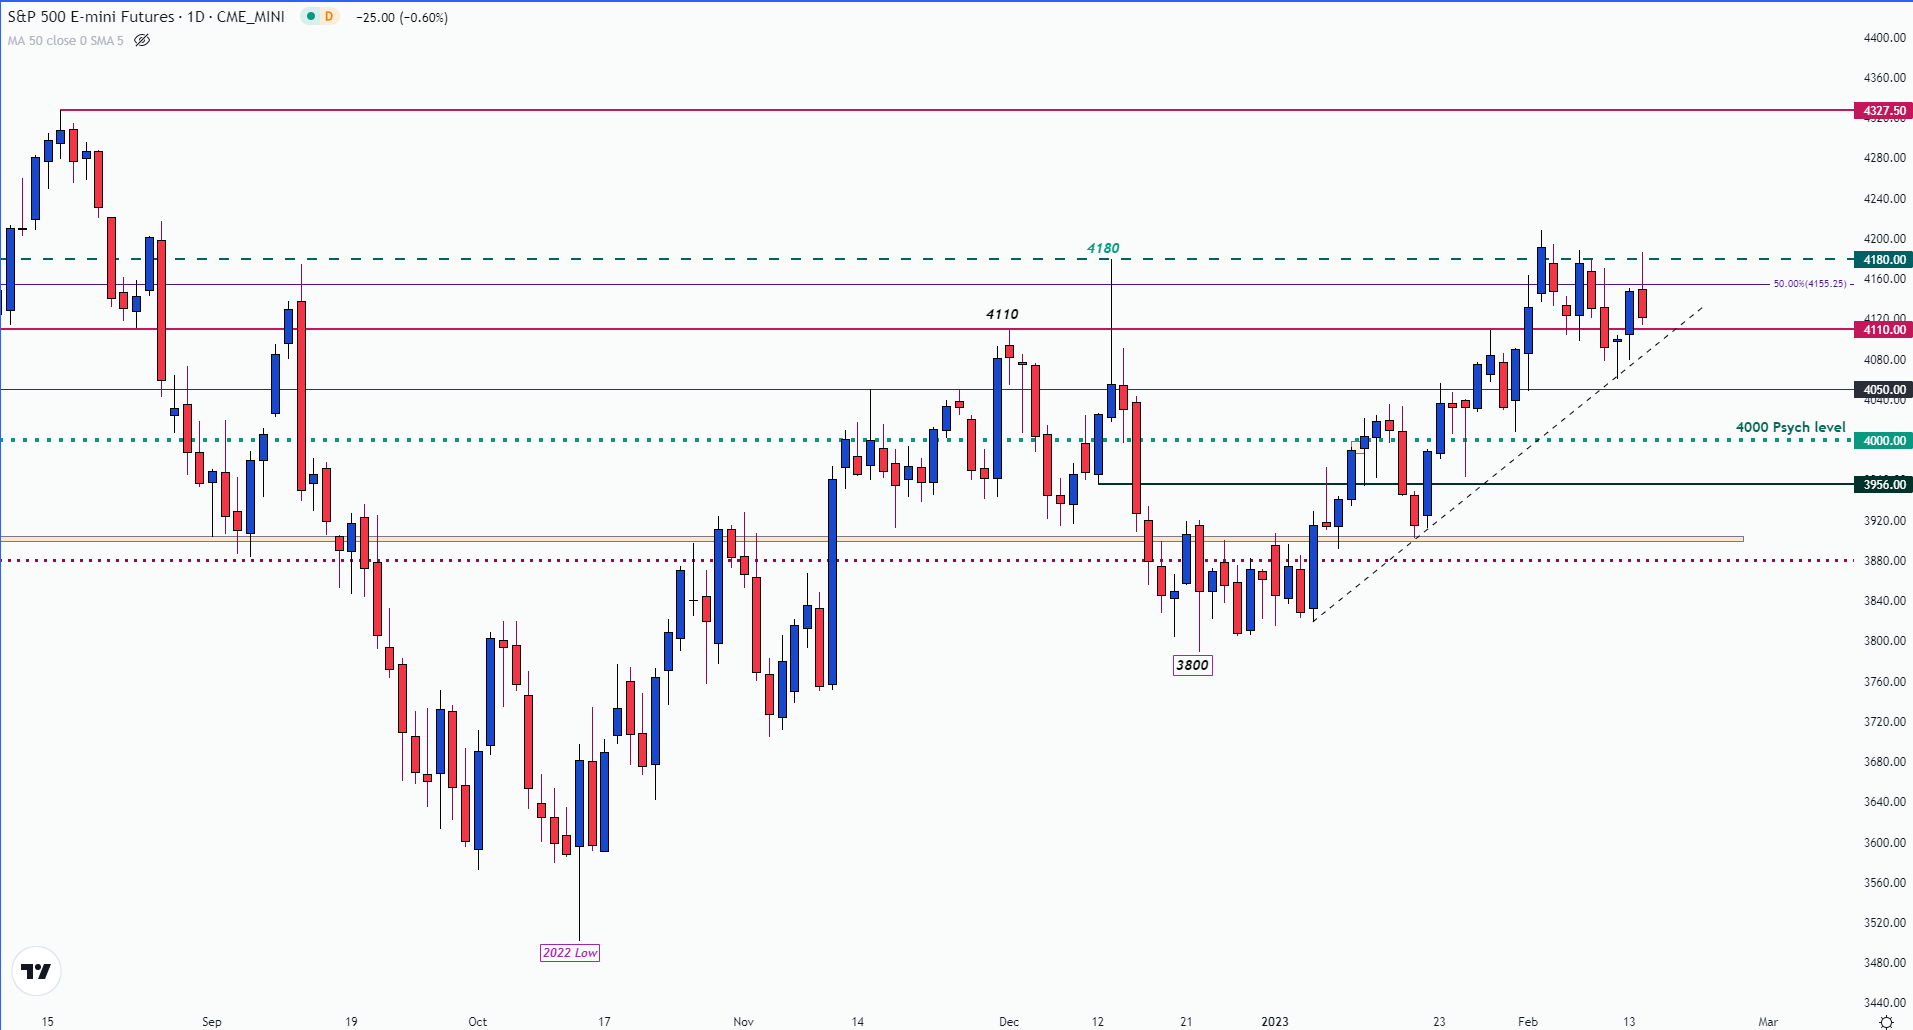
Chart prepared by Tammy Da Costa using TradingView
As investors continue to search for signs of a potential Fed pivot, a host of policy makers are expected to appear later today, providing an additional catalyst for stocks.
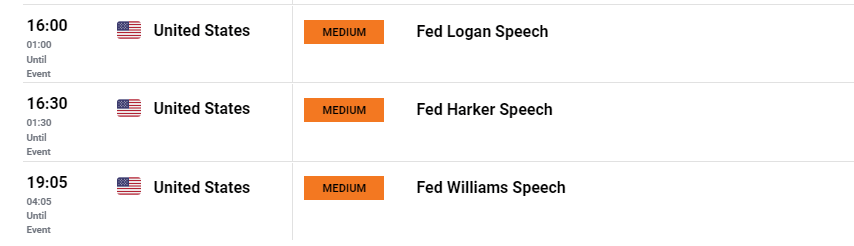
DailyFX Economic Calendar
For the Dow Jones, prices initially surged to a high of 34,551 before plunging back to 34,033. With prices currently heading back above 34000, a continuation of the recovery could see a potential retest of 34,400.
Trade Smarter - Sign up for the DailyFX Newsletter
Receive timely and compelling market commentary from the DailyFX team
--- Written by Tammy Da Costa, Analyst for DailyFX.com
Contact and follow Tammy on Twitter: @Tams707


