


US DOLLAR OUTLOOK: BULLISH
- The US Dollar Index rises for the second week in a row, bolstered by rising Treasury rates
- U.S. bond yields reach more than four-week highs as traders reprice higher the path of monetary policy
- All eyes will be on the January inflation report in the week ahead

Most Read: Nasdaq 100 Outlook - Stock Market Rally Fizzles on Fed Monetary Policy Jitters
The U.S. dollar, as measured by the DXY index, had another solid week, up about 0.65% to 103.63 over the past five trading sessions, a move that allowed the greenback gauge to completely erased the losses recorded in January. The weekly gains were driven primarily by the strong jump in Treasury yields across the curve, which was triggered by expectations that the Fed will have to continue to raise borrowing costs and maintain a restrictive stance for longer than initially anticipated to win the battle against inflation.
The chart below shows how the 2-year and 10-year bond yields soared to more than four-week highs as traders repriced higher the monetary policy path, with the terminal rate now seen at 5.17% versus 4.92% earlier in the month, as shown by the 2023 Fed futures contracts included in the graph.
2023 FED FUTURES IMPLIED RATES VS US TREASURY YIELDS
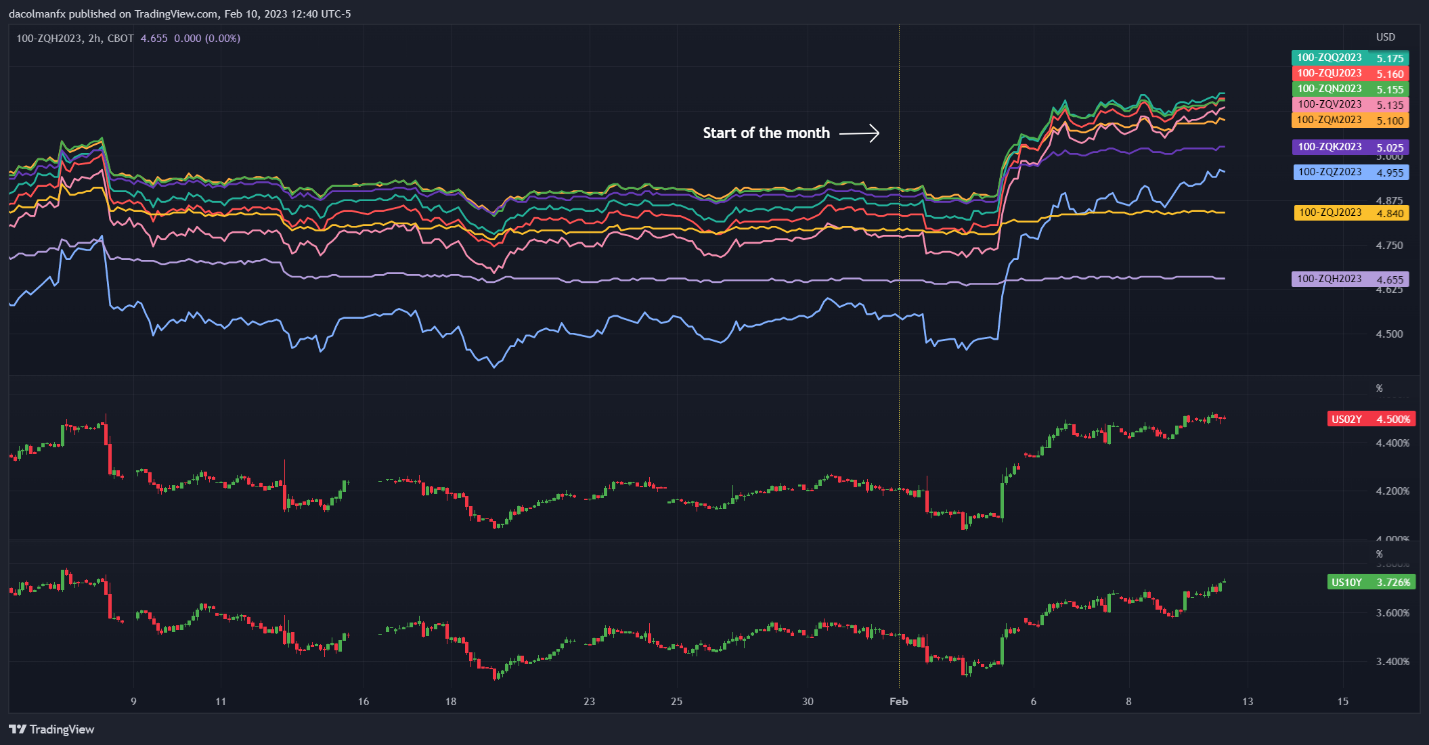
Source: TradingView
Trade Smarter - Sign up for the DailyFX Newsletter
Be the first to know what's moving the forex market!
Robust labor market data has changed Wall Street's calculus, leading traders to reassess expectations for FOMC hikes in light of the fact that the American economy remains extremely resilient and able to tolerate further tightening. By way of context, the January jobs report showed the U.S. employers added 517,000 jobs, nearly double consensus estimates. Strong hiring at a time of multi-decade low unemployment could keep wage pressures and household spending skewed to the upside, reinforcing CPI dynamics and slowing its convergence towards the 2.0% target.
We’ll get a better sense of how consumer prices have been evolving soon when the U.S. Bureau of Labor Statistics releases last month’s inflation report on Tuesday. Both headline and core CPI are forecast to have risen 0.4% on a seasonally adjusted basis, a change that would reduce the annual rate by two-tenths to 6.3% and 5.5%, respectively. The directional improvement, however, could disappoint expectations, especially for the all-items gauge, due to the surge in gasoline prices, which spiked 4.4% at the outset of the year according to the American Automobile Association.
An undesirable CPI surprise could lead traders to reprice higher the trajectory for the terminal rate, while reinforcing the higher-for-longer message articulated by several Fed officials. This scenario could further bolster yields, especially those at the front-end of the curve, paving the way for the U.S. dollar to extend its recovery in the coming weeks. For this reason, the DXY index may be biased to the upside in the near term.
In terms of technical analysis, the U.S. dollar index appears to be approaching a key technical resistance near 103.80/104.00 after its recent rebound. If this area is decisively breached in the coming trading sessions, bulls could launch an attack on 104.65, followed by 105.60. On the flip side, if prices are rejected from current levels, initial support appears around the 103.00 handle, a floor created by a long-term rising trendline. Below this region, the focus shifts to the 2023 lows.
US DOLLAR INDEX (DXY) DAILY CHART
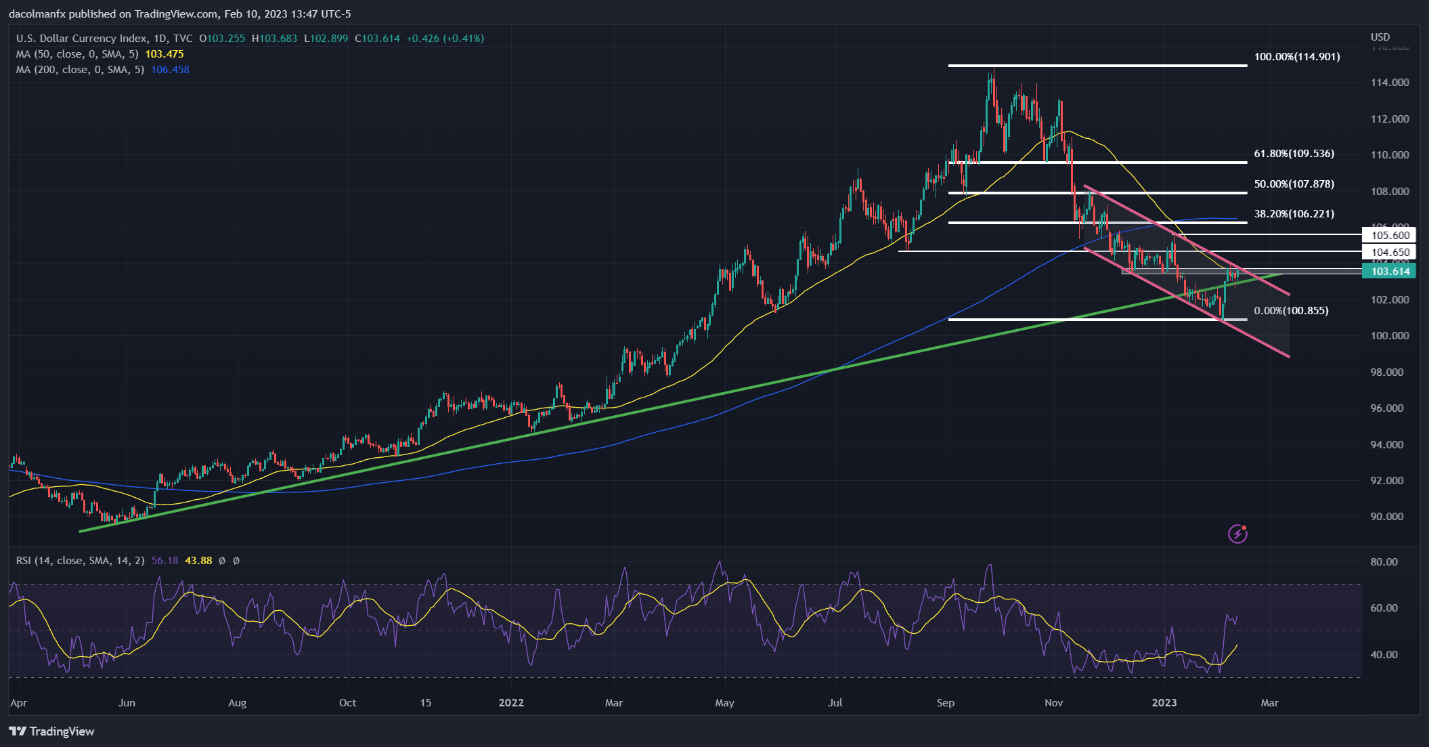
US Dollar Index Prepared Using TradingView


