


FTSE 100 rise above psychological resistance – Can bullish momentum hold?
FTSE 100 is currently trading a critical juncture that has remained as resistance for the past few weeks. After rising back above prior resistance turned support at 7000, a weekly close above this level could offer a window of opportunity for bulls.
After falling to a fresh yearly low of 6707.62 earlier this month, a swift retaliation from bulls allowed prices to rebound back above a level that remains as critical support at 6825. With this zone assisting in limiting the downside move since May of last year, a series of candlesticks that have been rejected at this zone makes it even more significant for both the short and longer-term move.

Meanwhile, after four weeks of being rejected by psychological resistance, the body of the weekly candle is looking to close above 7000, offering a glimmer of hope bulls.
FTSE 100 Weekly Chart
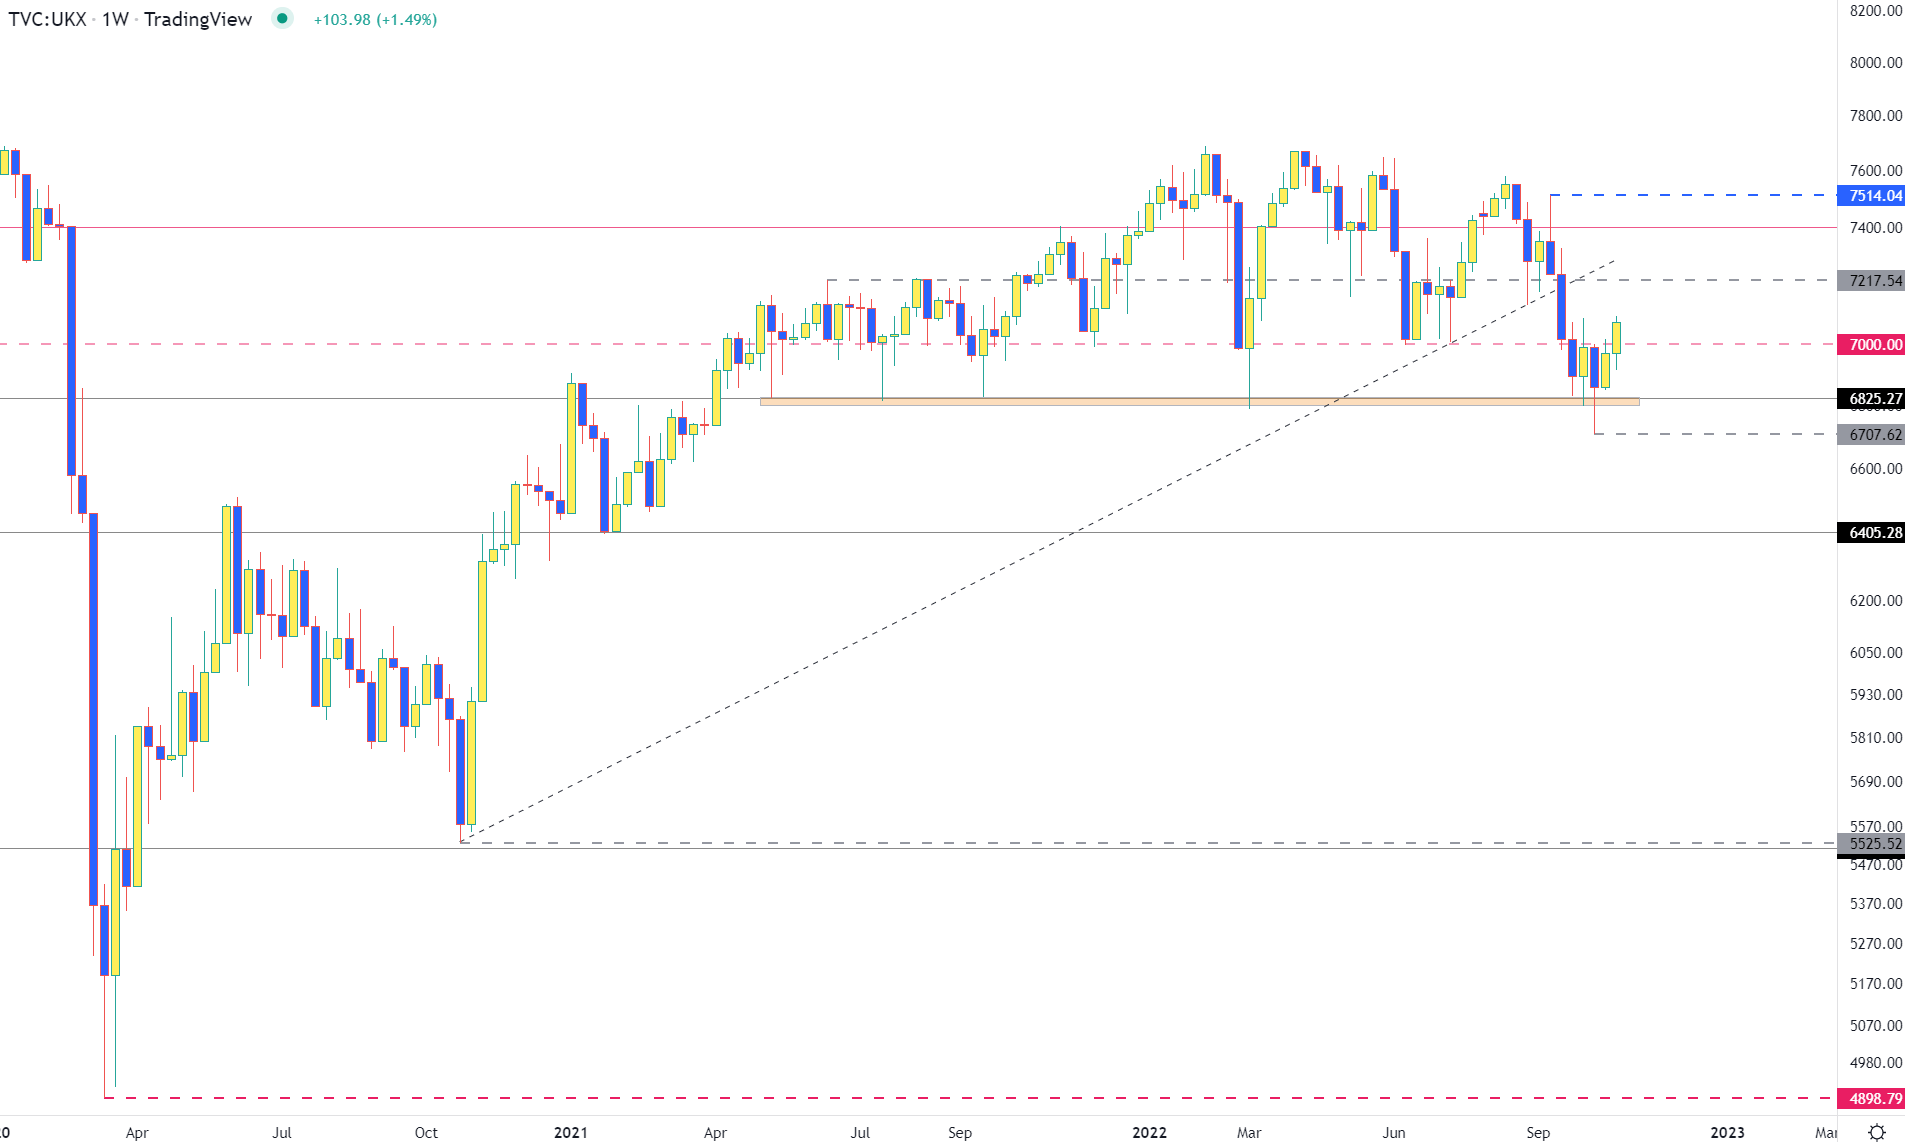
Chart prepared by Tammy Da Costa using TradingView
For bullish continuation to be possible, the next challenge will be for prices to rise above the next wall of resistance forming between 7200 and 7217.

FTSE 100 Daily Chart
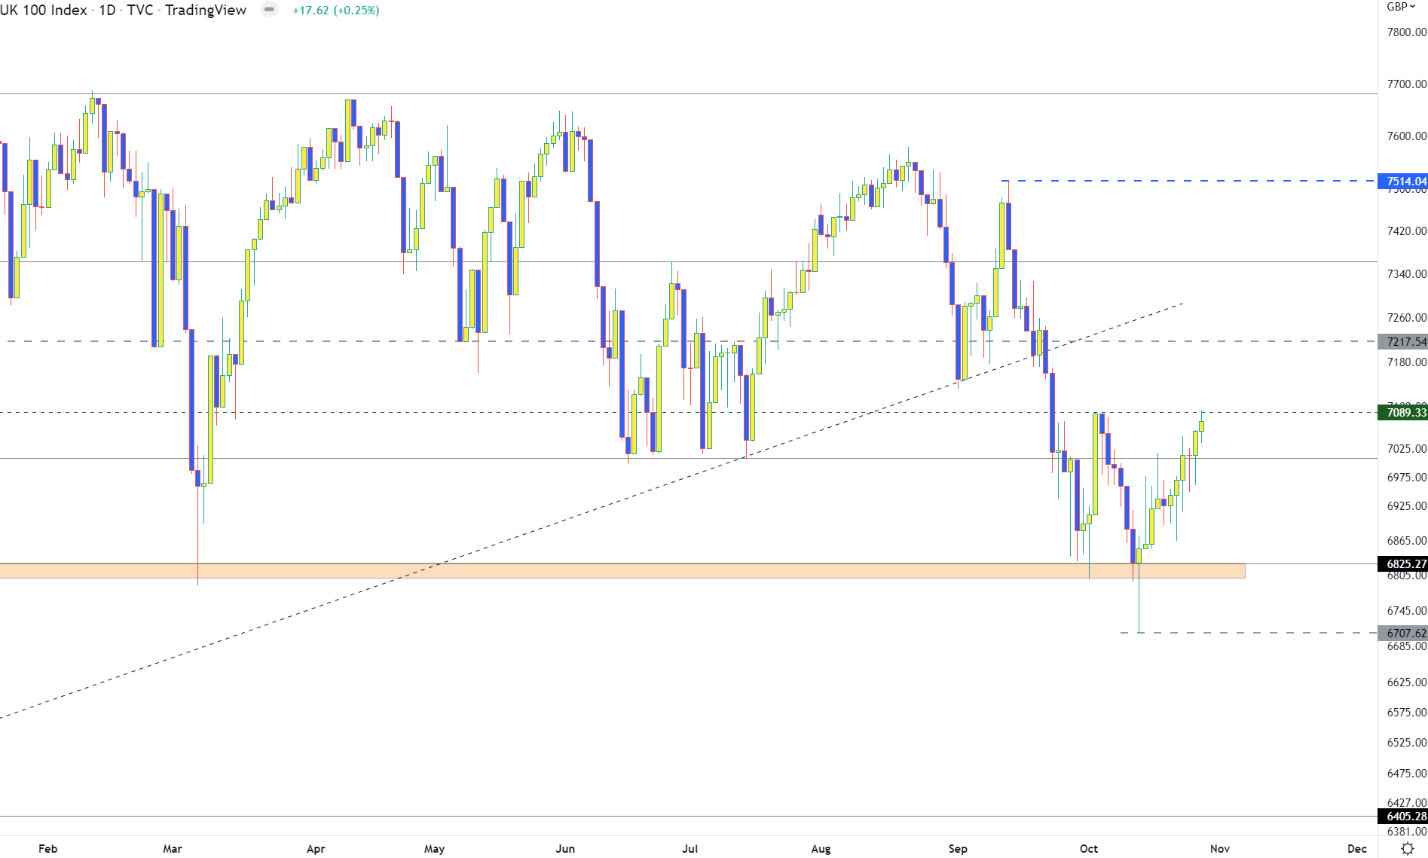
Chart prepared by Tammy Da Costa using TradingView
But, with key psychological levels and trendline resistance from the October 2020 move still intact, it is possible for bears to step back in, driving prices lower. If prices fall below 6825, the next level of support will likely hold at the September low of 6707.
FTSE 100 Sentiment
| Change in | Longs | Shorts | OI |
| Daily | 49% | -16% | 2% |
| Weekly | 55% | -22% | -2% |
FTSE 100: At the time of writing, retail trader data shows 54.89% of traders are net-long with the ratio of traders long to short at 1.22 to 1.The number of traders net-long is 21.73% lower than yesterday and 21.87% lower from last week, while the number of traders net-short is 27.23% higher than yesterday and 21.31% higher from last week.
We typically take a contrarian view to crowd sentiment, and the fact traders are net-long suggests FTSE 100 prices may continue to fall.
Yet traders are less net-long than yesterday and compared with last week. Recent changes in sentiment warn that the current FTSE 100 price trend may soon reverse higher despite the fact traders remain net-long.
--- Written by Tammy Da Costa, Analyst for DailyFX.com
Contact and follow Tammy on Twitter: @Tams707


