

Indices Technical Forecast: Bullish
- It was another week of strength for stocks with the S&P 500, Nasdaq and Dow all posting gains last week.
- The Thursday CPI report printed in-line with expectations and markets absorbed the messaging from Chair Powell quite well. The big question now is whether bulls can batter through resistance in the S&P 500 as the 2022 bearish trendline is coming back into the picture.
- The analysis contained in article relies on price action and chart formations. To learn more about price action or chart patterns, check out our DailyFX Education section.

It was a week of strength for stocks which furthers the theme that’s been brewing for the past few weeks. The S&P 500 was slammed a month ago after the release of CPI data for the month of November, despite the data printing below expectations. That prodded a possible reversal theme in equities with another push-lower a day later at the December FOMC rate decision.
But, as highlighted here, a massive area of support came into play shortly after at 3802-3810 in the S&P 500, and that level held the lows into year-end. Along the way, a range began to build – and then an even tighter consolidation pattern showed with the build of a symmetrical triangle inside of that range.
The symmetrical triangle started to give way last Friday but price remained constrained below range resistance at 3912-3928. A quick breakout to start last week snapped back, support showed at prior triangle resistance (green box, below), and bulls jumped in on Tuesday morning to take-control of the trend.
S&P 500 Two-Hour Price Chart

Chart prepared by James Stanley; S&P 500 on Tradingview
S&P 500 – The Big Trendline Awaits
Last year was marked by a strong sell-off in the first half of the year and for most of 2022, price action in the S&P 500 remained below a bearish trendline taken from January and March swing highs. The lone test above that trendline was brief, on the morning of December 13th, around the release of CPI data before the reversal theme showed up.
But that reaction simply led to support at 3802 and after a few weeks of build there, buyers are starting to show a more concerted push for trend continuation scenarios.
From the weekly chart below, last year’s sell-off in the S&P 500 was building one large falling wedge formation. These are often approached with the aim of bullish reversals so while the fundamental backdrop is questionable, to be optimistic, the chart below indicates the potential for continued strength.

S&P 500 Weekly Price Chart
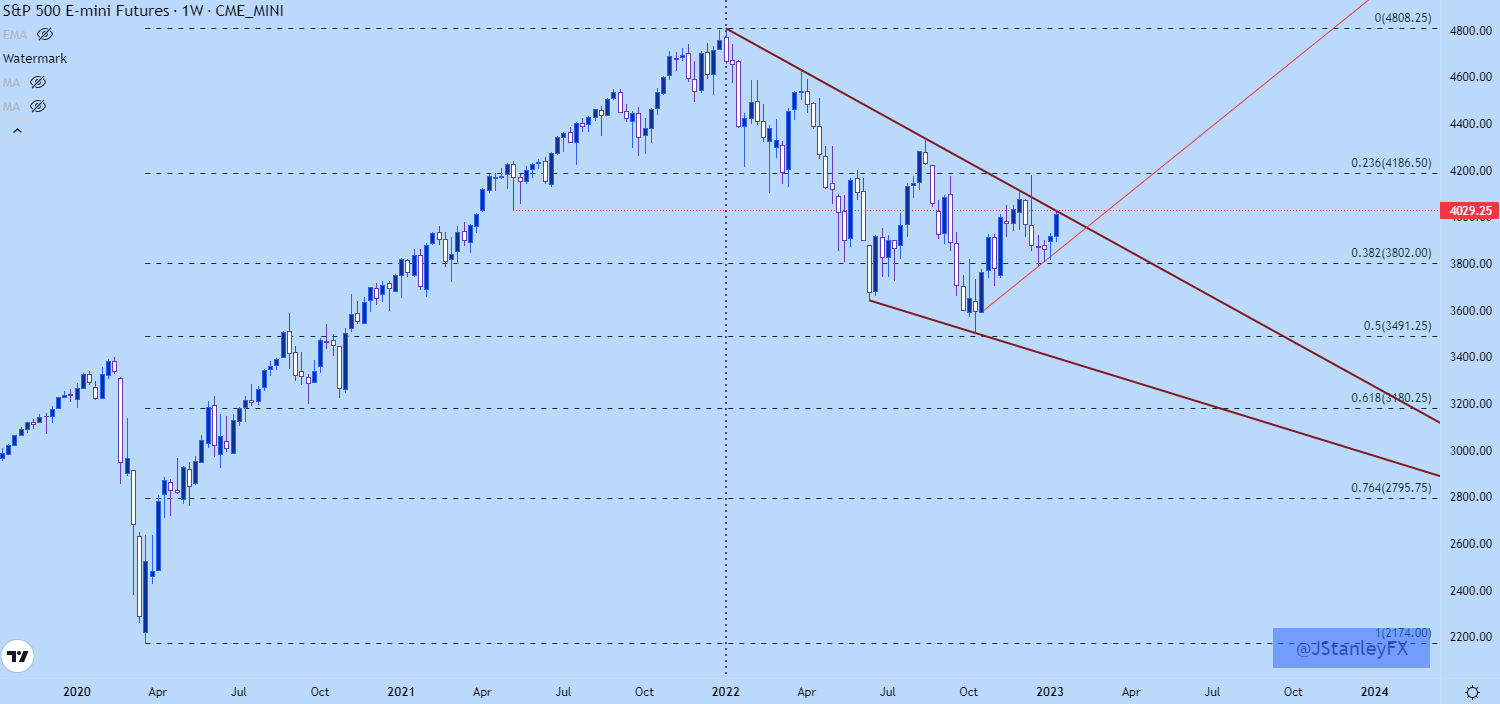
Chart prepared by James Stanley; S&P 500 on Tradingview
S&P 500
For next week, the S&P 500 is setup with bullish breakout potential after four consecutive daily gains. The forecast will be set to bullish for the week ahead.
S&P 500 Daily Price Chart
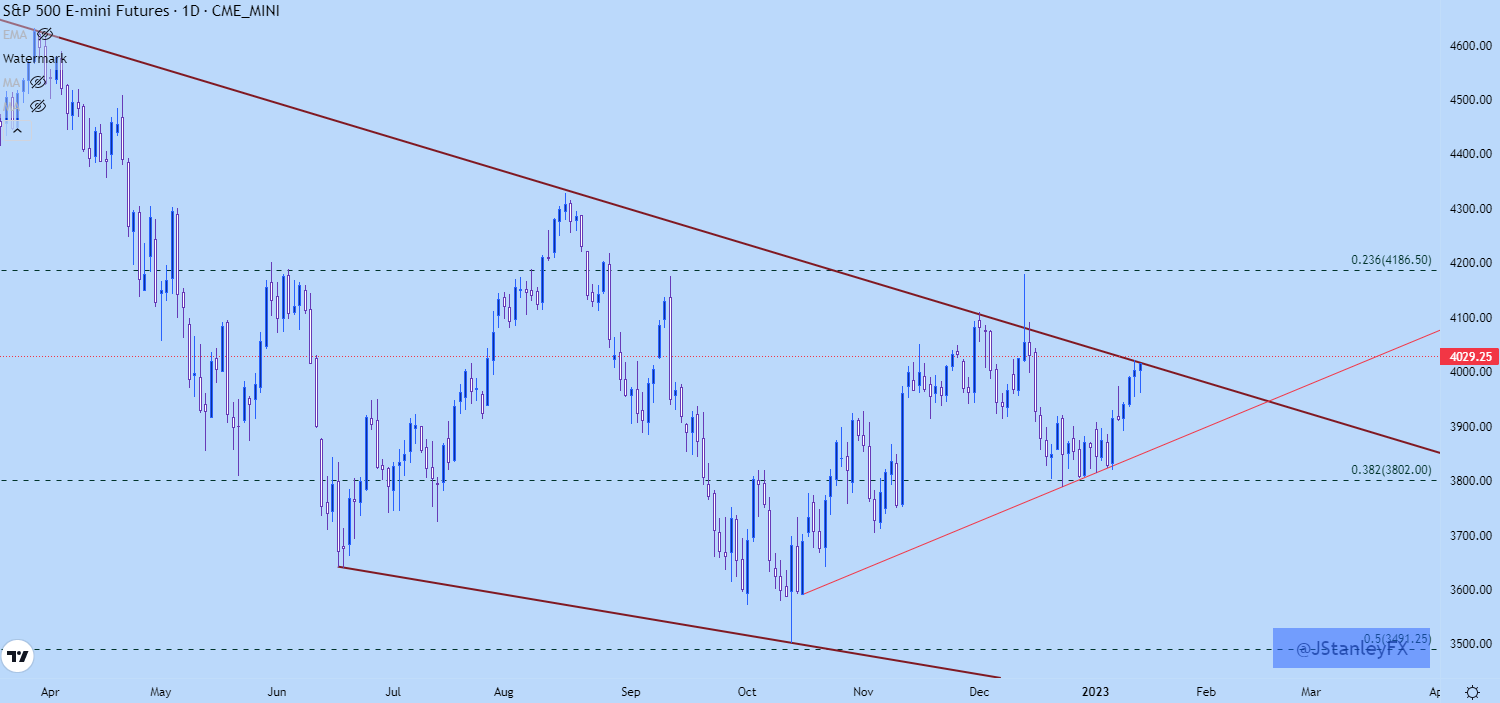
Chart prepared by James Stanley; S&P 500 on Tradingview
Nasdaq
The Nasdaq remains the laggard for bullish themes amongst the three major US indices. To open 2023 trade there was the prospect of a bigger-picture breakdown when price began to re-test the 10,751 level. But that support held, like how it played out the week before, and that led into a bounce last week.
At this stage, the tech-heavy index does appear to be the least bullish amongst the three bourses looked at in this report but nonetheless, this week’s bullish response after the prior week’s dragonfly doji keeps the door open for higher prices.
On the resistance side of the coin, 11,700 remains a key level for the Nasdaq but it’s the area just above the 12k psychological level that was such a stumbling block in November and December.
Nasdaq Weekly Price Chart
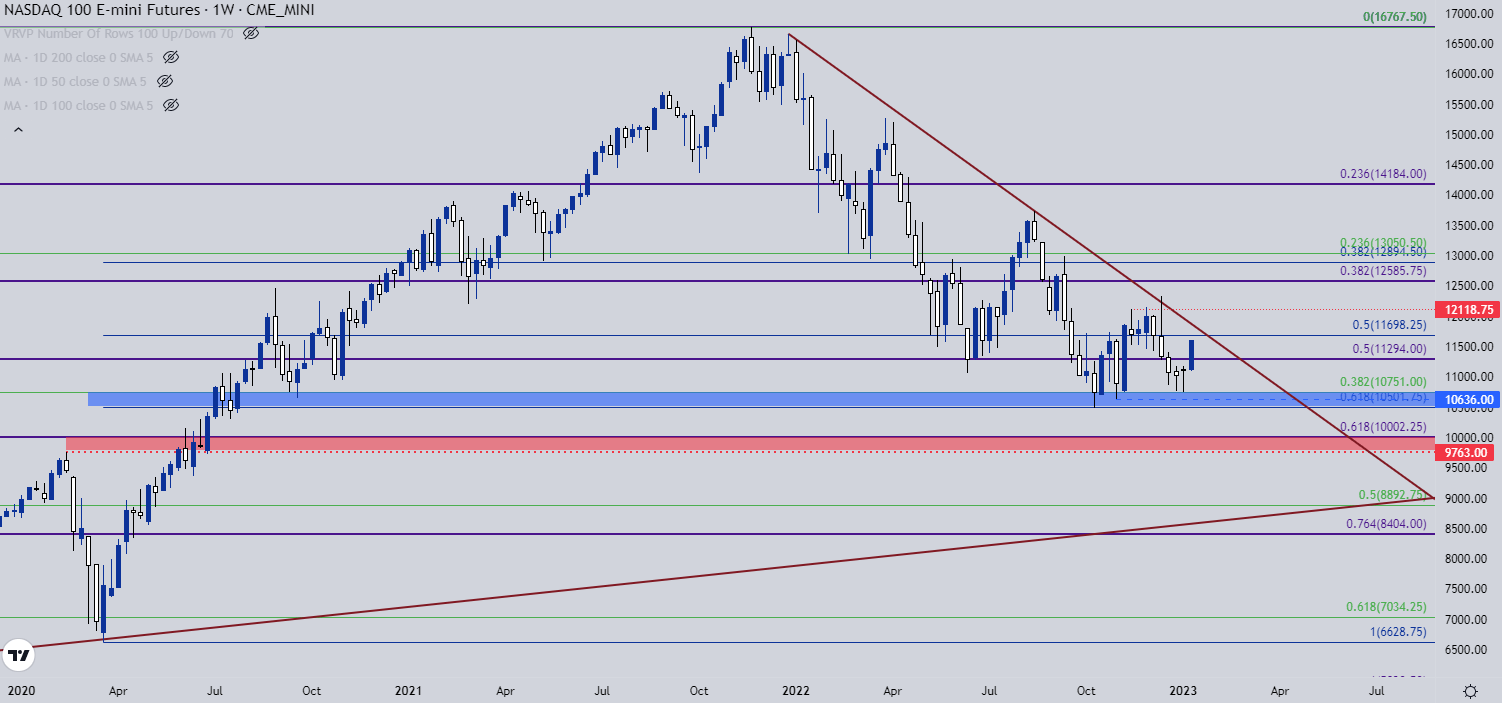
Chart prepared by James Stanley; Nasdaq 100 on Tradingview
Dow Jones
The Dow the more attractive setup for bullish scenarios and last week reiterated that.
While the Nasdaq remains well-below its own 2022 bearish trendline and while the S&P 500 encounters its own, the Dow used that level as a trampoline for a strong bullish bounce in December trade. That led to the build of an ascending triangle that started to give way last Friday. Monday showed a pullback to support at prior resistance, after which bulls jumped into continue the move and that brought four consecutive days of gains to the index to finish the week.
Dow Jones Daily Price Chart
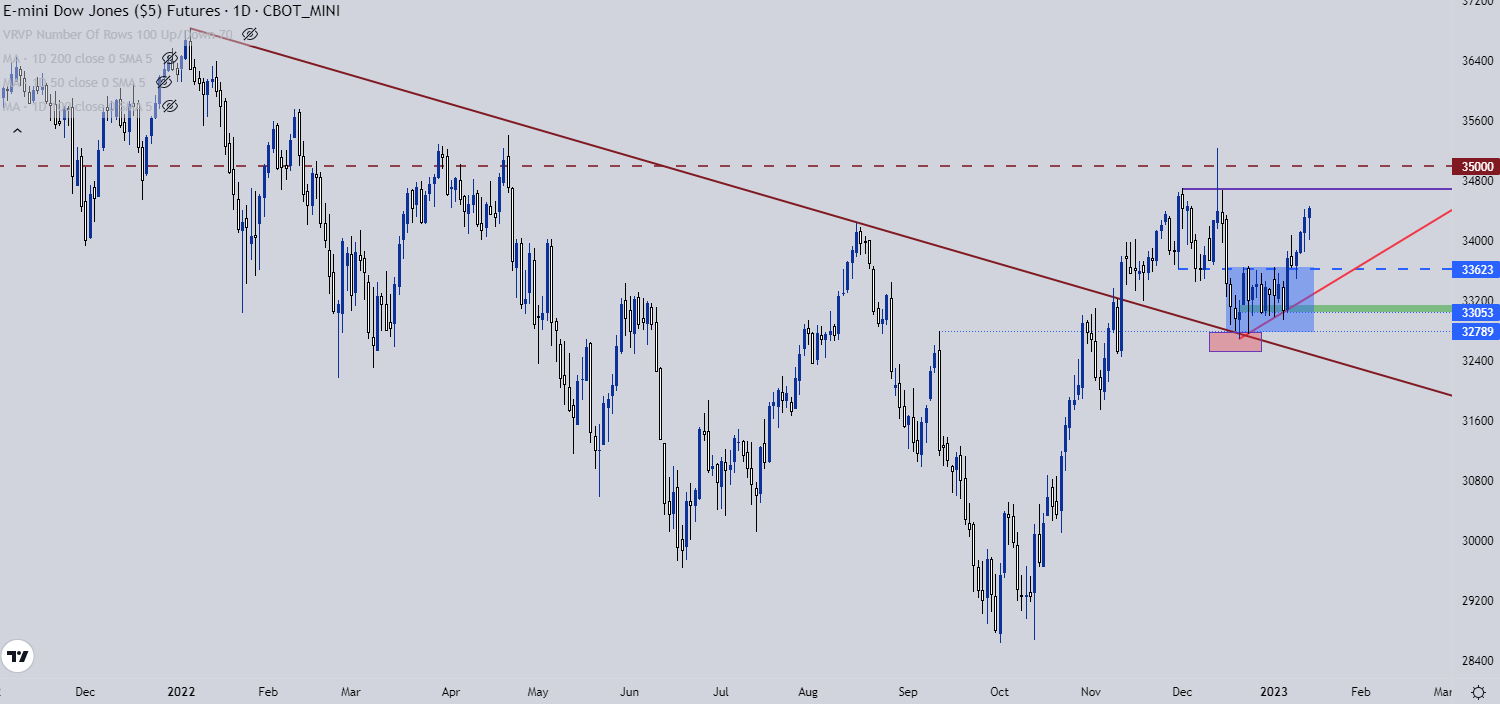
Chart prepared by James Stanley; Dow Jones on Tradingview
At this point, the weekly chart of the Dow looks like it’s ready for another test of the 35k psychological level. This has been a tough spot for the index as there was a build of resistance there through the first few months of 2022 trade before sellers began to push the breakdown.
And it did come back temporarily after the Q4 reversal theme began to play out, but that test was fleeting as prices pulled back to the 2022 bearish trendline before finding support. Given the reaction at that price, there was a heavy response from sellers and that may persist on subsequent tests, to a degree. But the bullish momentum being shown on a shorter-term basis sets up for a possible breakout if that level can come into play in short order.

Dow Jones Weekly Price Chart
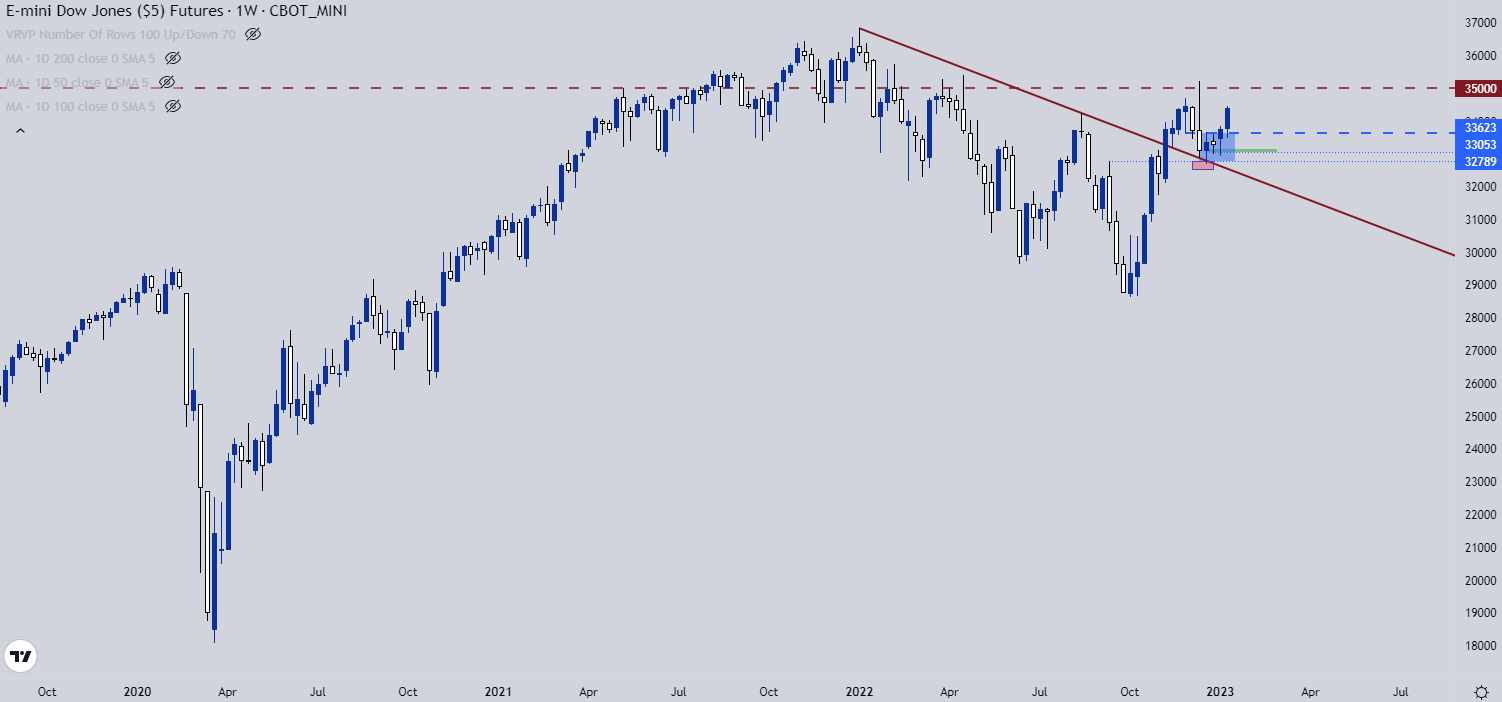
Chart prepared by James Stanley; Dow Jones on Tradingview
--- Written by James Stanley
Contact and follow James on Twitter: @JStanleyFX