
S&P 500 FORECAST:
- Speculators are overly negative on the S&P 500 in the futures markets according to CFTC data
- Extreme bearish positioning can sometimes lead to powerful and face-ripping rallies
- Looking at price action, the S&P 500 continues to forge a double bottom pattern

Most Read: US Dollar Withers Despite Last Week Bullish Breakout. Are Bears About to Pounce?
The S&P 500 has proven highly resilient this year, defying numerous headwinds, including restrictive monetary policy, turmoil in the banking sector, and growing risks of a medium-term recession. Despite these challenges, the stock index is up nearly 8% in 2023 and approximately 6.5% since mid-March.
Increasing wagers against the S&P 500 in the futures markets by speculators haven’t been able to knock down the world’s most important equity benchmark off the recovery path either.
CFTC data reveals how non-commercial traders have been extremely bearish of late, with net positioning, which is the difference between long and short contracts, sitting near the most negative levels since 2011, as shown in the chart below.
S&P 500 NET POSITIONING IN THE FUTURES MARKET
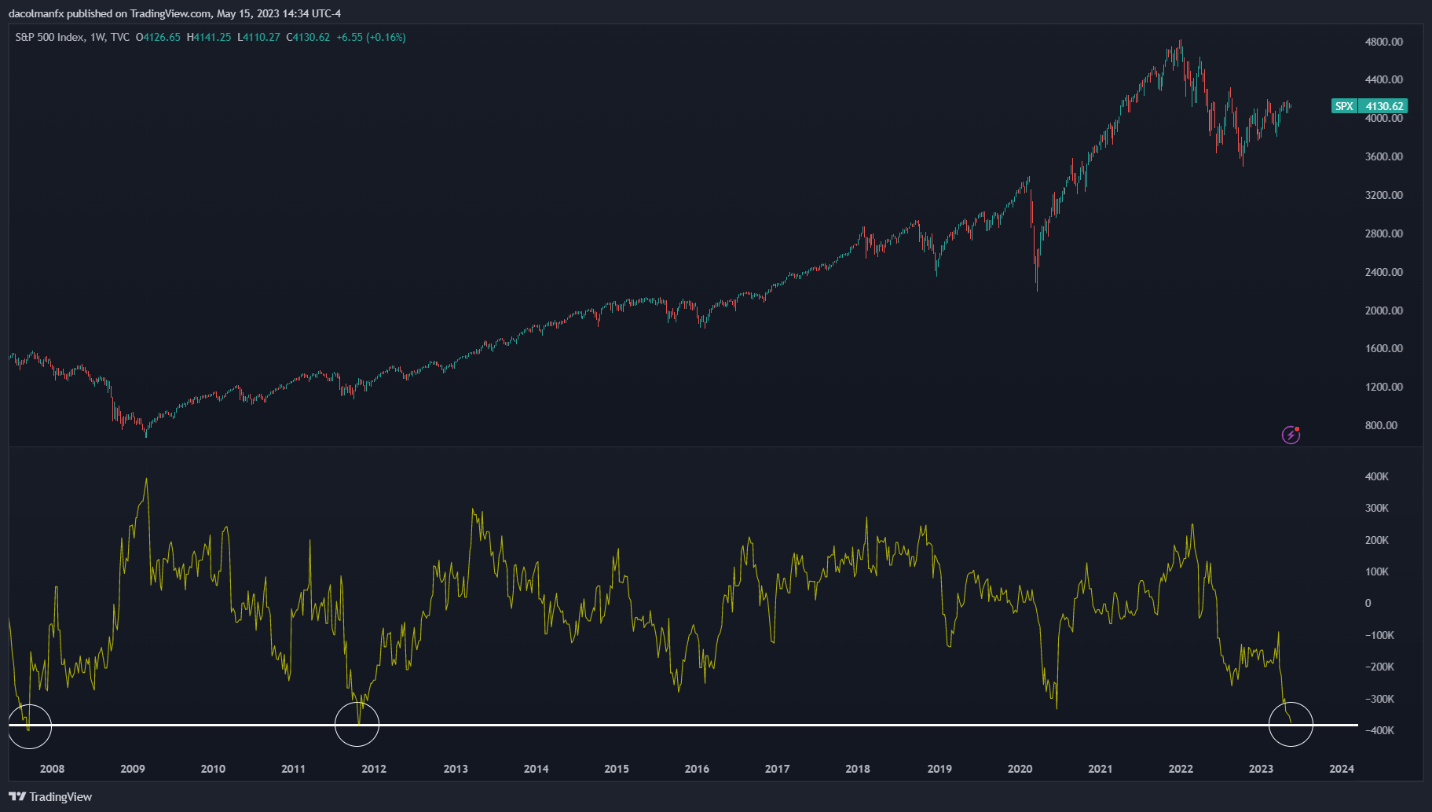
Source: TradingView
Although not always the case, extreme bearish positioning can at times lead to powerful short-squeezes if the right conditions are in place, paving the way for unforeseen face-ripping rallies.
In the S&P 500 example, speculators betting heavily against the index could find themselves on the wrong side of the trade in the event of a bullish breakout, rushing to offload their losing positions and covering their shorts, further reinforcing the upside move. This isn’t the baseline scenario but it’s one worth considering, especially if the economy holds up better than expected and dodges a recession.
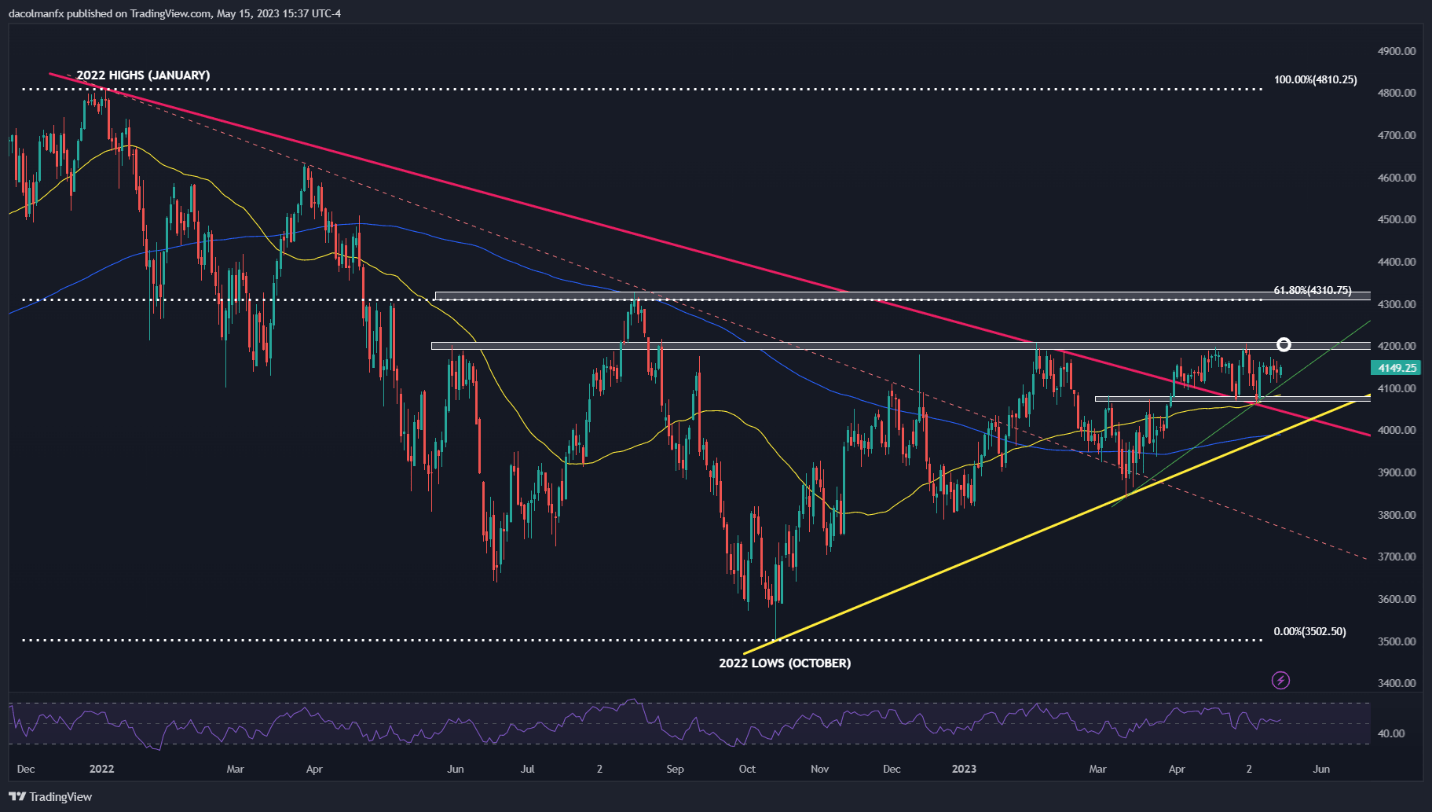
Focusing on price action, the S&P 500 appears to be forging a double bottom, a technical pattern with bullish connotations. The setup, which has not yet been completed, would be confirmed by a move above the neckline at 4,200 – an event that could push prices toward 4,310, the 61.8% Fib retracement of the 2022 decline.
On the flip side, if sellers regain control and drive prices lower, initial support lies at 4,100, followed by 4,075. If both floors are breached, the double bottom would be invalidated, opening the door for a pullback toward 4,050.
| Change in | Longs | Shorts | OI |
| Daily | 3% | -6% | -2% |
| Weekly | 34% | -22% | -2% |
S&P 500 TECHNICAL CHART