


Silver Technical Analysis
- Long-term uptrend remains intact despite pick up in selling last week.
- 23.20 emerges as an important confluence zone of support, RSI approaches oversold
- The analysis in this article makes use of chart patterns and key support and resistance levels. For more information visit our comprehensive education library

Long-Term Uptrend Remains Intact Despite Recent Selling
Silver prices have come under considerable selling, which began at the end of last week and continues into this week so far, although, at a much slower pace. Silver prices had largely been tracking those observed in gold but the recent drop in both commodities saw silver come off worse. Last week’s decline for the silver metal measured 4.8% while the decline in gold only measured 1.36% - perhaps underscoring the superior safe-haven appeal of the yellow metal.
The weekly chart below shows the early signs of indecision at the 50% Fibonacci retracement of the major 2021 to 2022 decline at 23.83. Price action remains within the ascending pitchfork which largely contained the bullish move. Further downside movement brings 23.20 into focus as the intersection of the underside of the pitchfork and a proven pivot point dating back to October last year.
Silver Weekly Chart
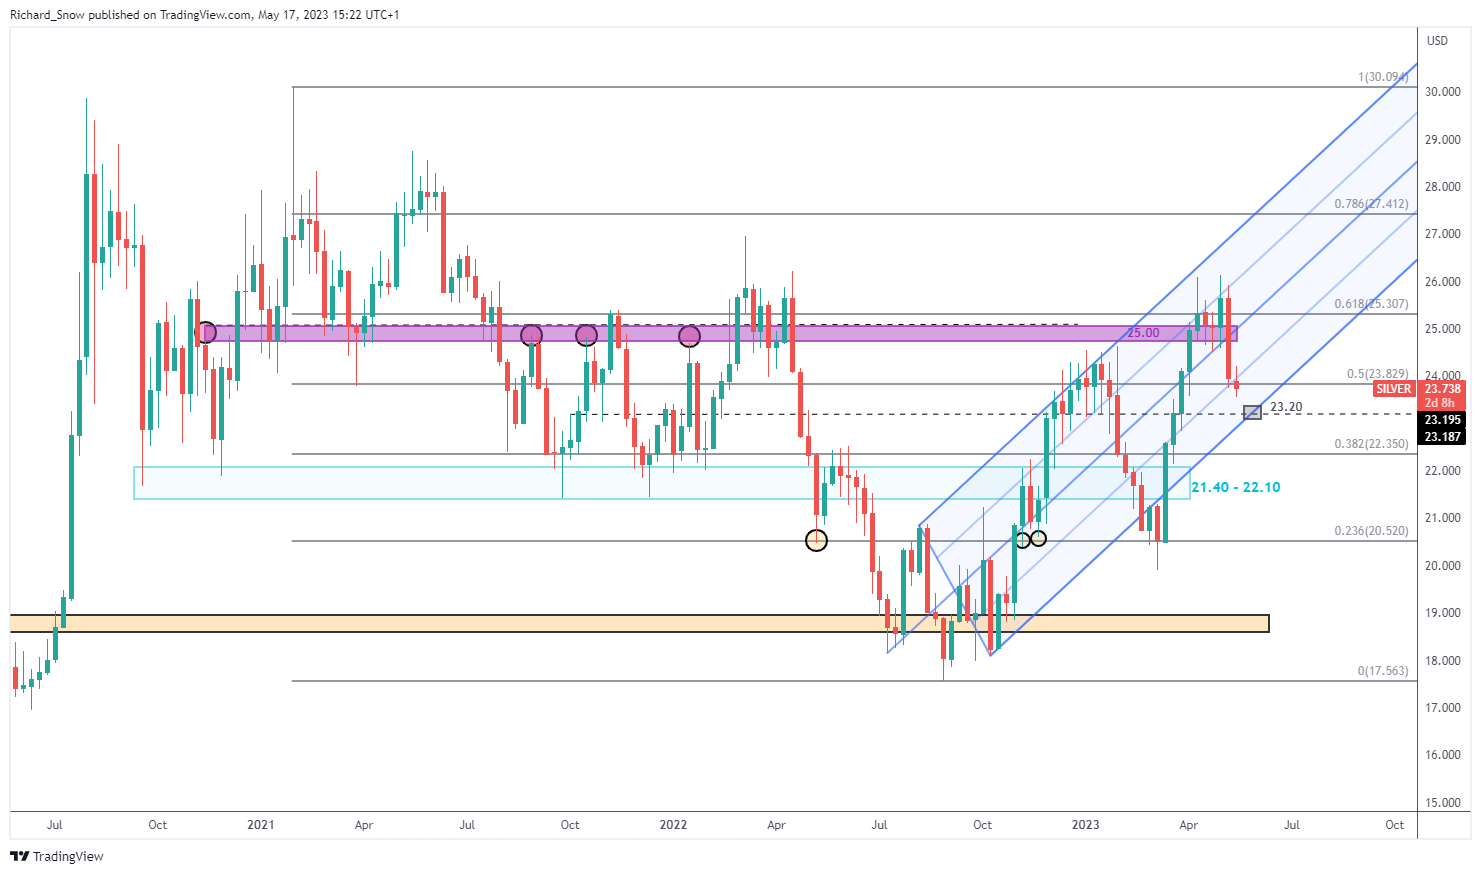
Source: TradingView, prepared by Richard Snow
The daily chart adds more granular detail to the recent downward movement, revealing a slowing of bearish momentum. Once more 23.20 is of note to the downside and should price action slow and reverse higher, 24.85 emerges as the most significant level of resistance. With the RSI yet to reach oversold territory, we could still see more selling up ahead.
Silver Daily Chart
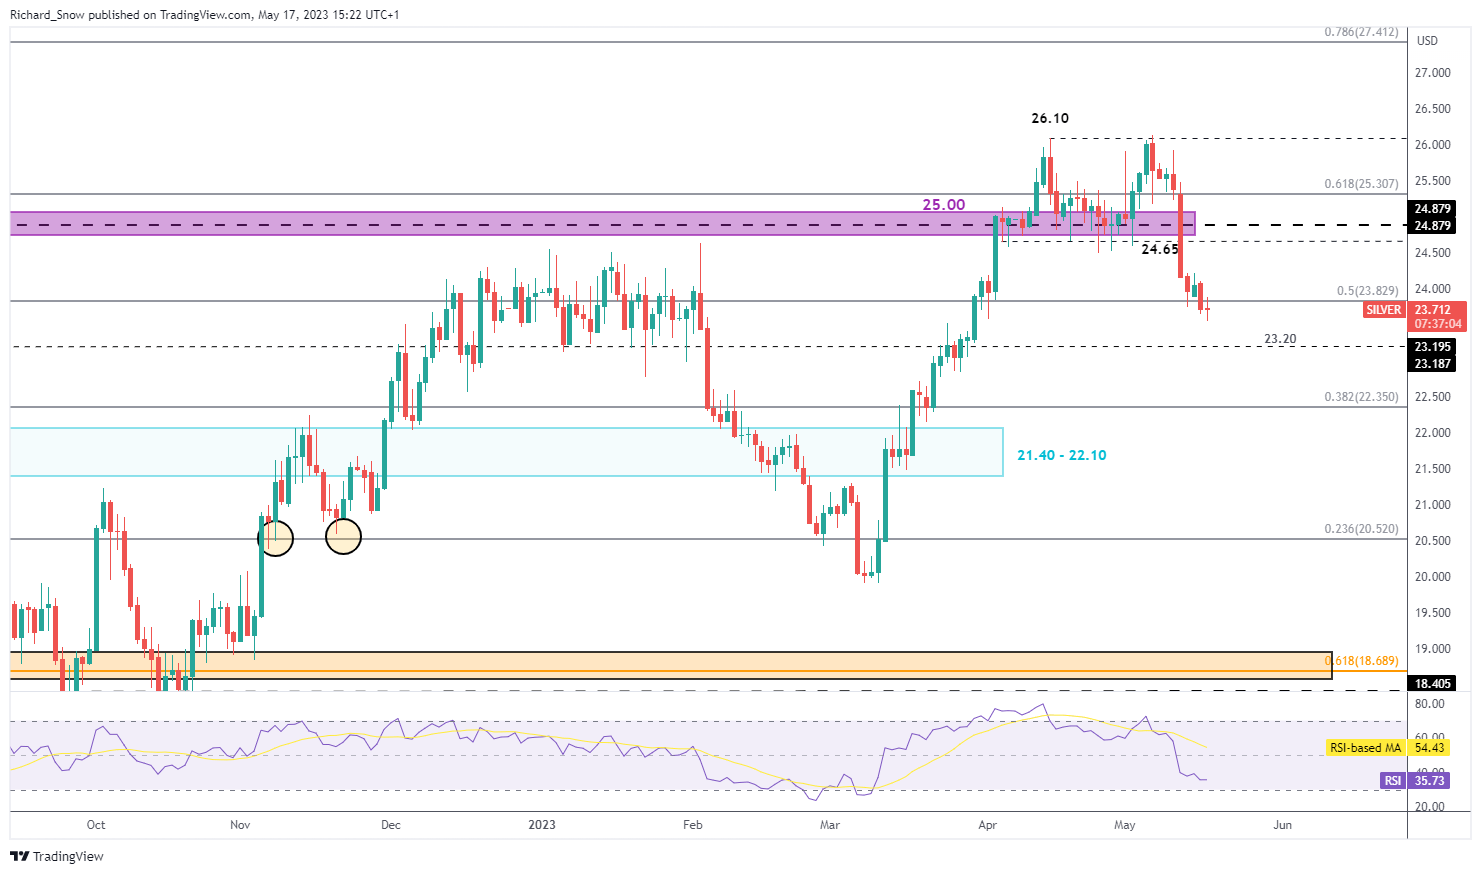
Source: TradingView, prepared by Richard Snow
Trade Smarter - Sign up for the DailyFX Newsletter
Receive timely and compelling market commentary from the DailyFX team
--- Written by Richard Snow for DailyFX.com
Contact and follow Richard on Twitter: @RichardSnowFX


