


Indices Forecast:
- The S&P 500 is set up for a possible bullish breakout, testing a key point of resistance that currently marks the October highs.
- After setting a low during the CPI release earlier in October, stocks have started to put in tones of a recovery move. This doesn’t necessarily denote that a bottom is in-place, but there is a building case for a deeper counter-trend move in the S&P 500 and the Nasdaq. And the Dow has been extremely strong over the past week.
- I looked into counter-trend potential in stocks last Monday and that theme is continuing to play-out as we get deeper into earnings.
- The analysis contained in article relies on price action and chart formations. To learn more about price action or chart patterns, check out our DailyFX Education section.

I looked into the US Dollar yesterday and in that article I talked quite a bit about stocks, as well, because in my mind these themes seem very much tied together at the moment. The push point is one in the same, at least, with the Federal Reserve pushing tighter monetary policy in effort of stemming inflation. That’s been positive for the USD and negative for stocks.
In equities, however, there’s been a building case for a pullback in the broader bearish trends. This started to build going back to the CPI release a couple of weeks ago, when another higher-than-expected print brought a bullish move in stocks. I looked into this last Monday, highlighting a falling wedge pattern in the S&P 500. That’s since been broken-through with a bullish move, and buyers have continued to push the matter into this morning’s breakout to fresh monthly highs.
With earnings in-focus ahead of the Fed, this is a theme that could have some continuation potential. But, it’s important to note just how key the upcoming earnings releases will be as we’re hearing from some of the mega-cap corporates in the coming days. A warning from one of these companies can change opinions very quickly. We’re hearing from all of Facebook/Meta, Google/Alphabet, Amazon and Apple this week.
In the S&P 500, the falling wedge from last week served as a springboard for the current bullish trend. Prices broke out from that formation on Tuesday, but pulled back on Wednesday and Thursday, all the way until price found support at a key zone around the 3660 level on the chart, which was confluent with prior wedge resistance.
That led into a bullish engulfing formation on Friday. Those are often tracked as a momentum continuation scenarios and that’s what’s happened so far this week.
S&P 500 Daily Price Chart
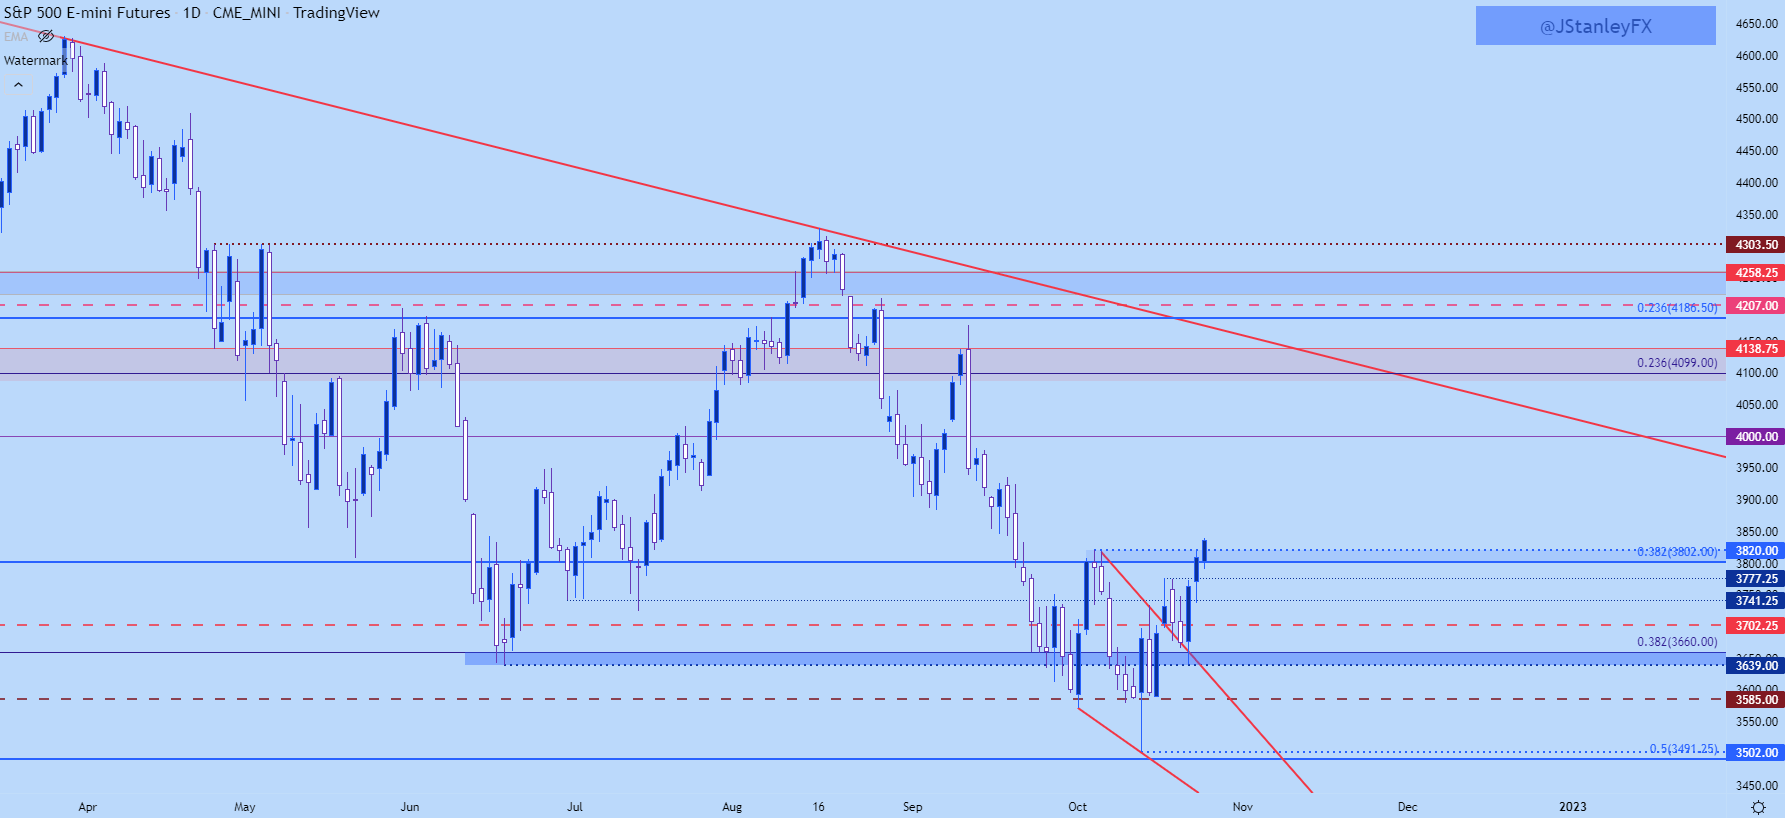
Chart prepared by James Stanley; S&P 500 on Tradingview
S&P 500 Shorter-Term
We have the higher-high, the question now is how aggressive bulls want to push the move. Prior resistance at 3802-3822 now becomes support potential, and there’s more support potential around prior swings at 3777. If that doesn’t hold, a test of 3741 won’t look so bullish as buyers would’ve allowed the sequence of higher-highs and lows to fail.
On the upside of price, I’m tracking next resistance around 3850 and then 3886 followed by 3929.

S&P 500 Four-Hour Chart
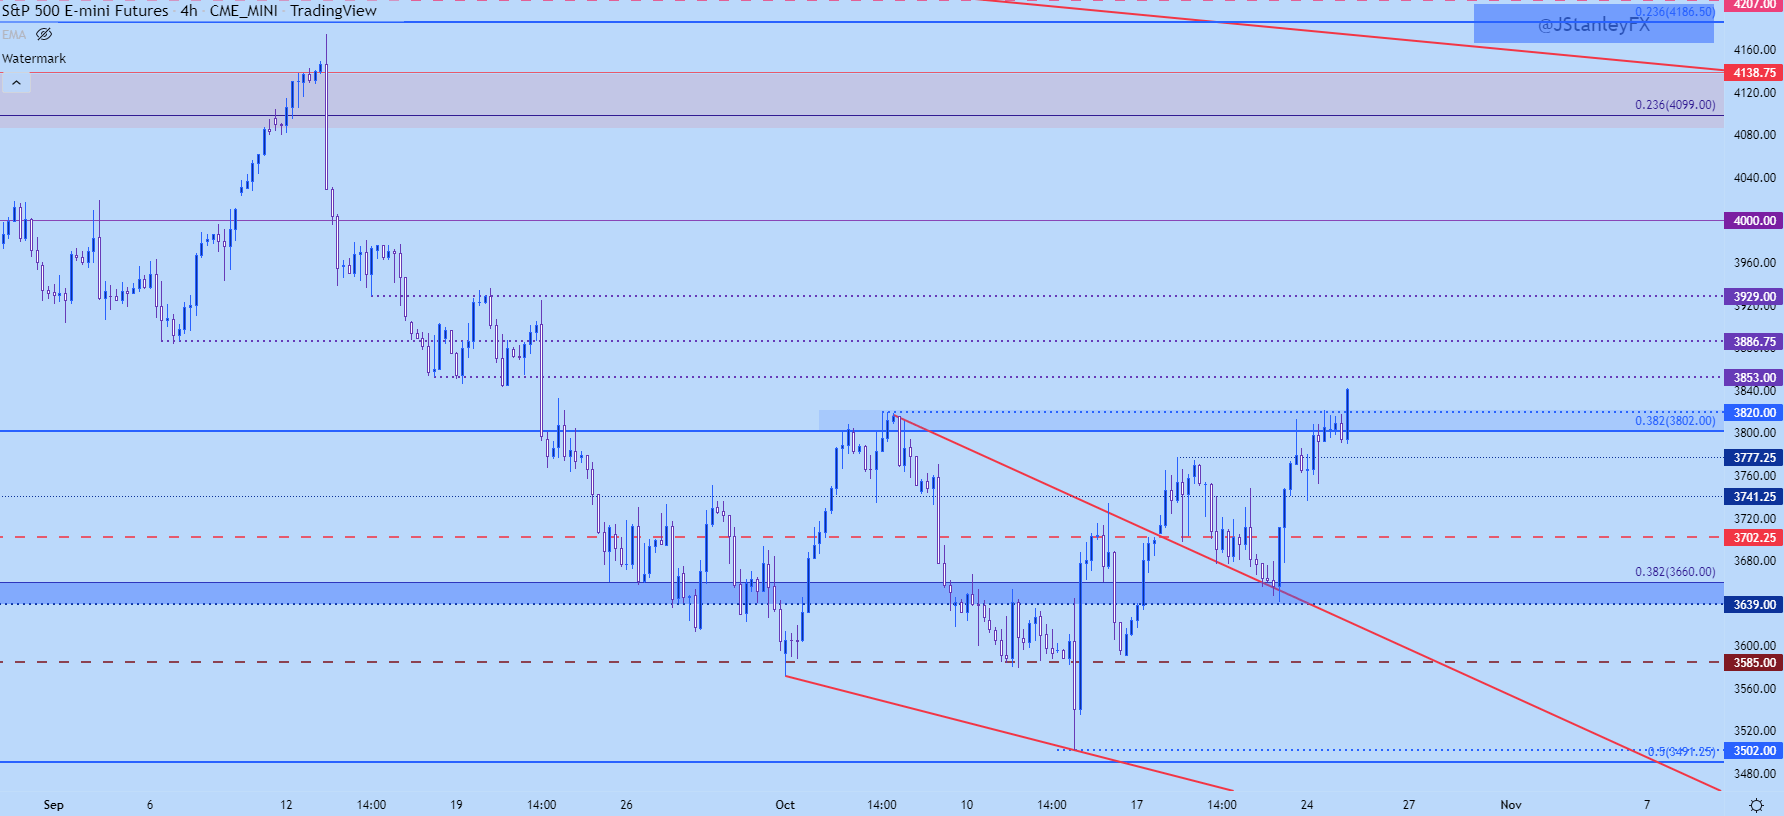
Chart prepared by James Stanley; S&P 500 on Tradingview
Nasdaq 100
The Nasdaq is also pushing up to a fresh high but it hasn’t yet taken-out the October high, that rests at a key spot of resistance around 11,700. That’s getting nearer but the complication at this point is that it seems as though price will be stretched if/when it comes into play in the early-part of today’s session.
So, I’m tracking higher-low support at a prior point of resistance, taken from around 11,550. The topside of the next resistance zone is 11,792 and if we get a break-above that, bulls could have some room to run as the reversal will take on a more decisive look.
Nasdaq Four-Hour Chart
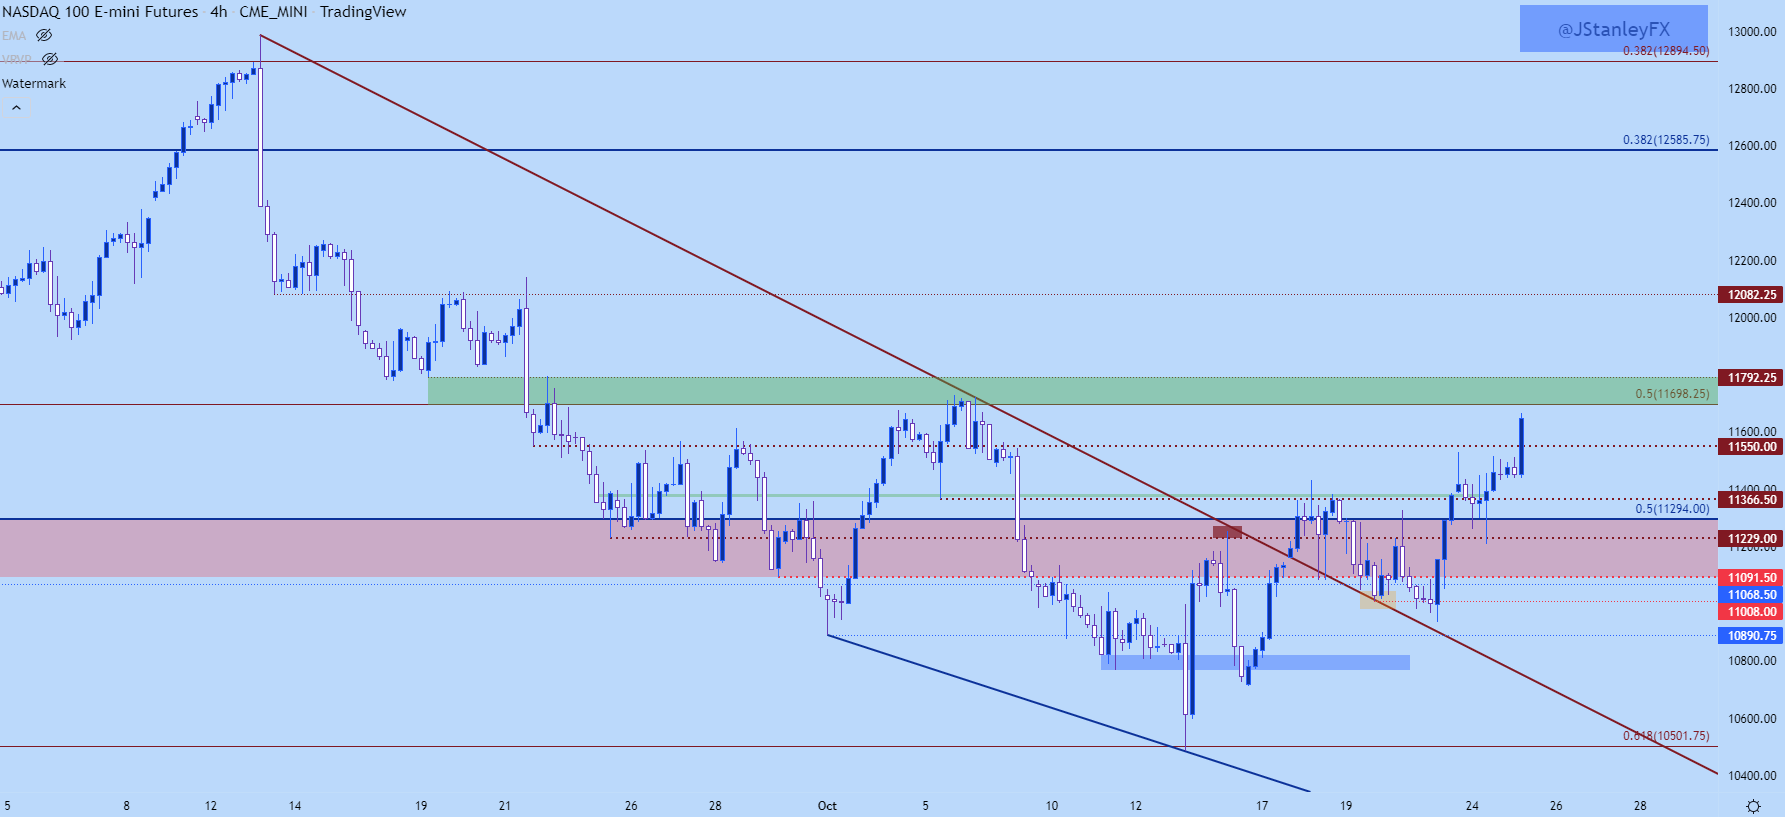
Chart prepared by James Stanley; Nasdaq 100 on Tradingview
The Dow
From a price action perspective it appears as though the Dow is leading the way with a strong move that had already started last week. A resistance level is already being tested at 31,766. Similar to the Nasdaq above, the market is looking stretched on a short-term basis, so I’m tracking support at 31,392 and a hold there keeps the door open for bullish strategies.
Dow Jones Daily Chart
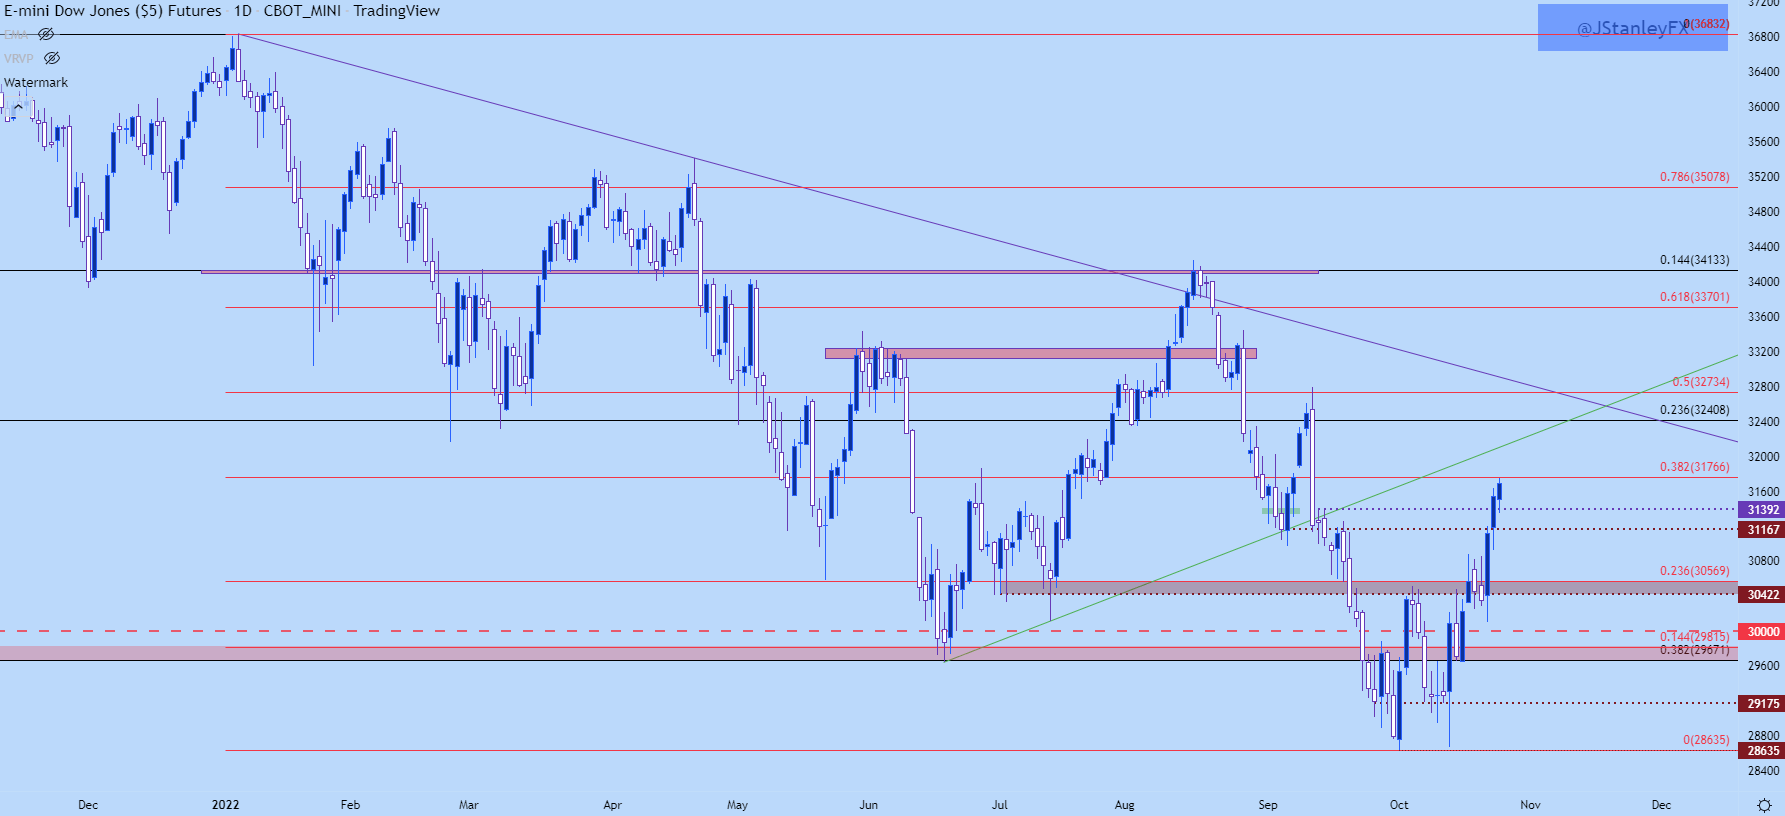
Chart prepared by James Stanley; Dow Jones on Tradingview
--- Written by James Stanley, Senior Strategist, DailyFX.com & Head of DailyFX Education
Contact and follow James on Twitter: @JStanleyFX


