


S&P 500, Nasdaq 100, and Dow Jones Forecasts and Analysis
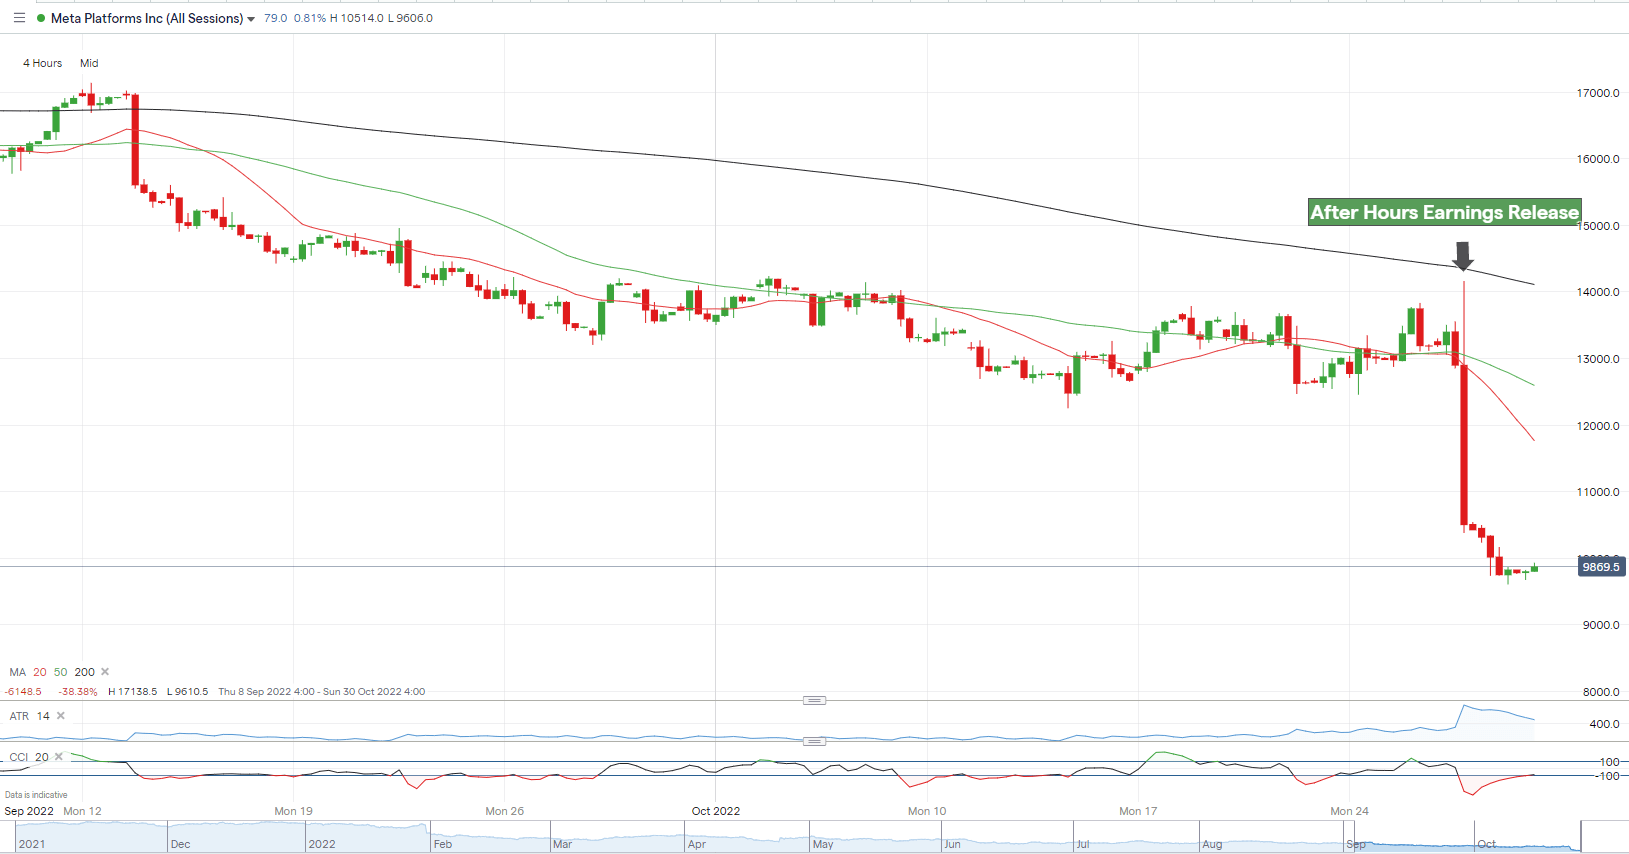
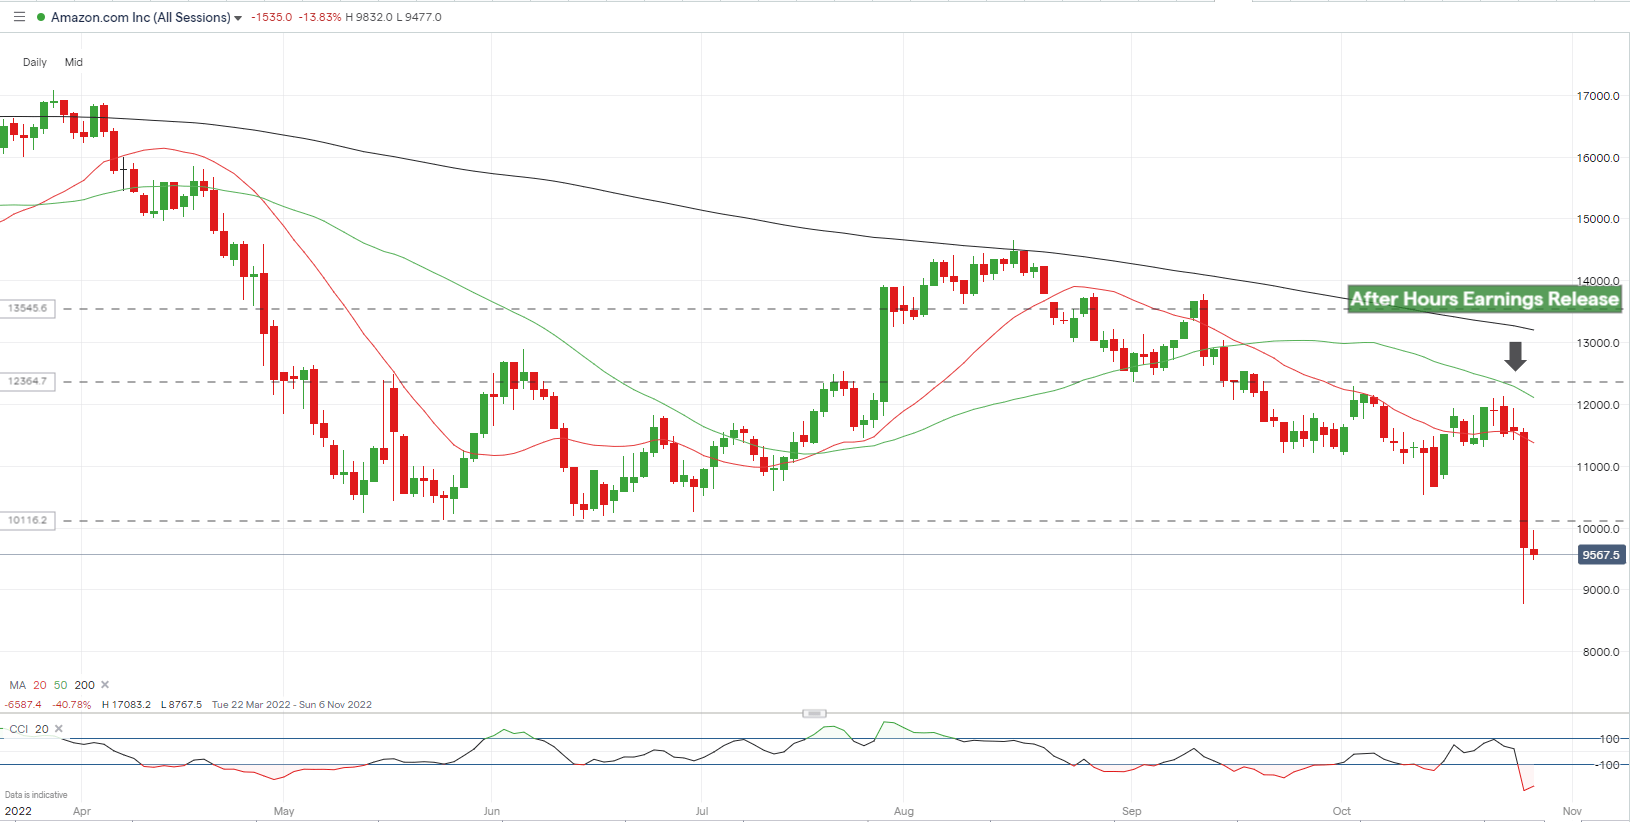
- Meta and Amazon both slump 20%+ after releasing Q3 figures.
- Uber, Airbnb, and Coinbase are all on the Q3 docket next week.

US equity markets have had a mixed week with the tech bellwether Nasdaq 100 hit with bouts of high volatility. Amazon (AMZN) slumped over 20% in minutes after releasing disappointing figures, mirroring price action seen by Meta (META) earlier in the week. Hundreds of billions of USD were wiped off the Nasdaq this week, reversing the positive sentiment that has been building of late, leaving a question mark over why the market was not given better intra-quarter guidance. Equity markets have been pushing higher recently on thoughts that global interest rate hikes may soon be peaking. While global central banks are highly unlikely to stamp on the brakes anytime soon, they may be lifting their foot off the accelerator gently to try and slow the recent aggressive rate of monetary tightening.
Meta Plunges Over 13% on Grim Earnings After Nasdaq Plunge
Amazon Plummets Around 20% as AWS and Sales Disappoint Expectations
What is Earnings Season & What to Look for in Earning Releases?
Next week the tech market release schedule is not so frantic but high profile, sentiment names Uber (UBER), Airbnb (ABNB), and Coinbase Global (COIN) will all be worth following.
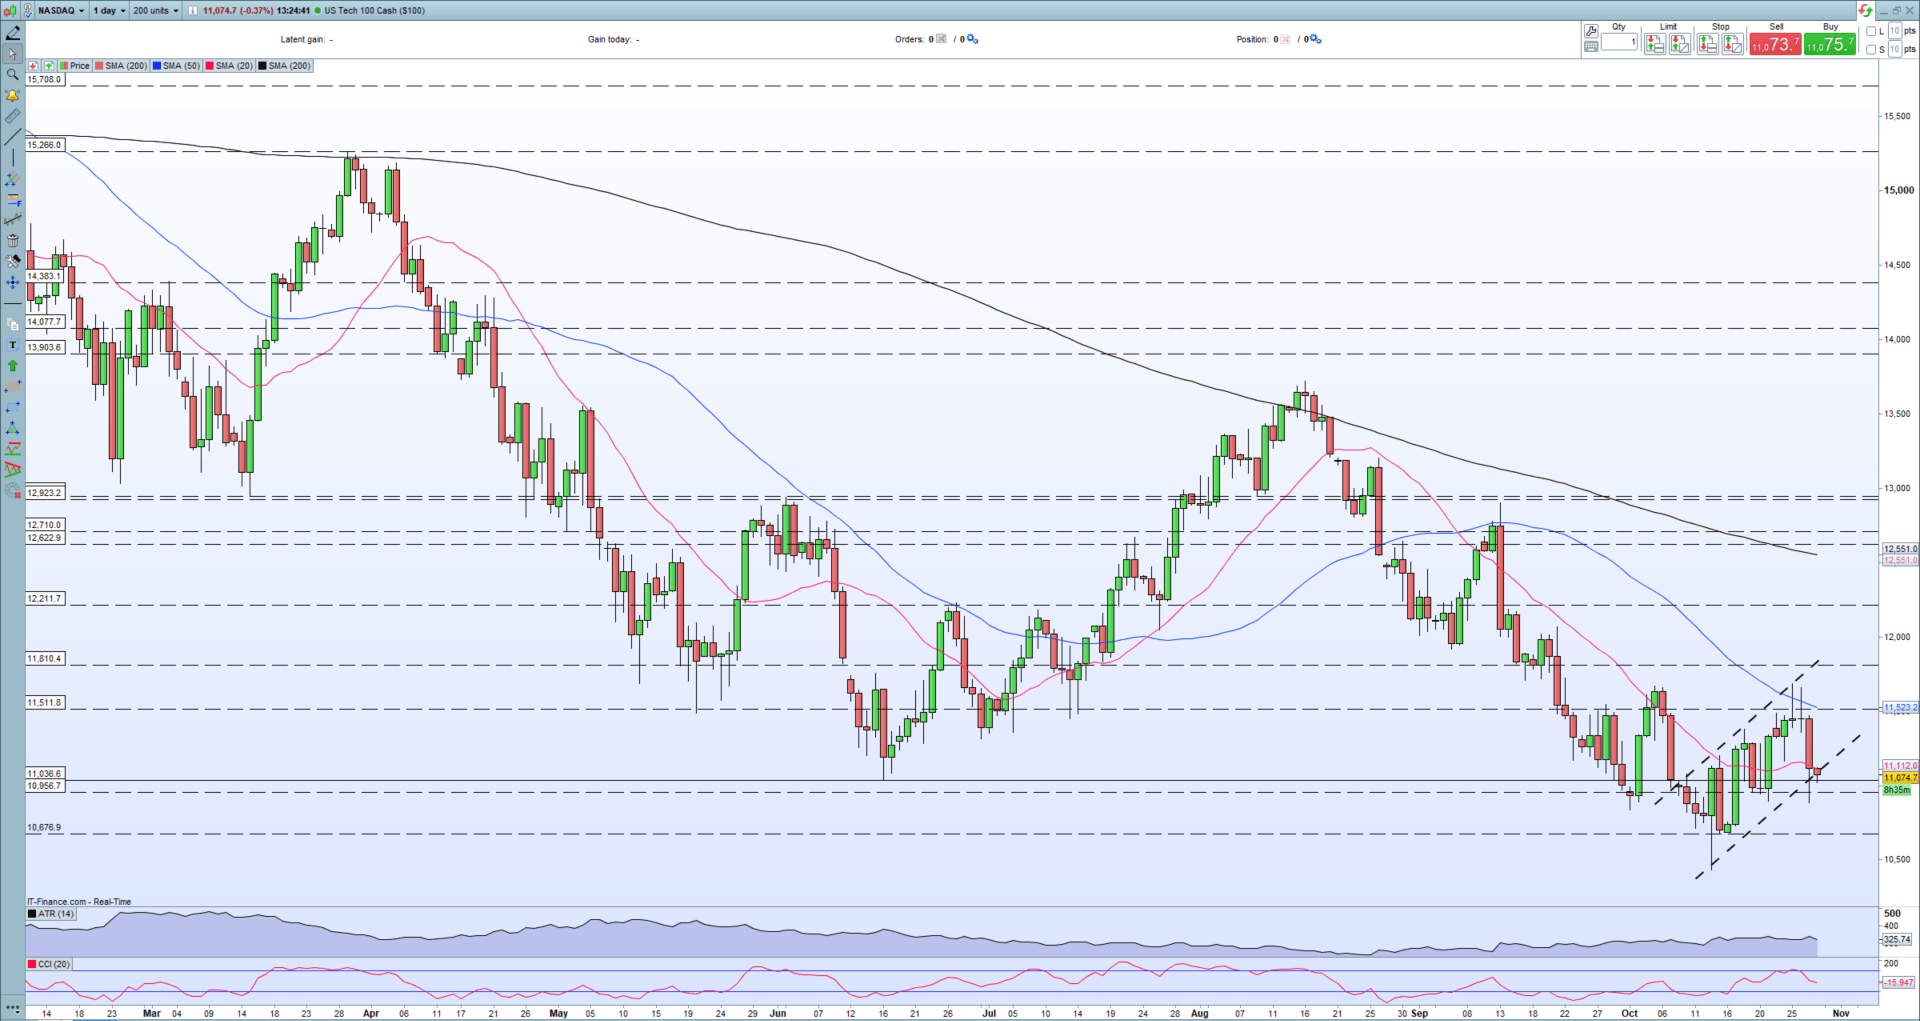
The Nasdaq 100 is back where it started the week and has broken a series of higher highs and higher lows made over the last two weeks. There is also an ominous bearish flag being formed, suggesting lower prices ahead.
How to Trade a Bearish Flag Pattern
Nasdaq 100 – Daily Chart
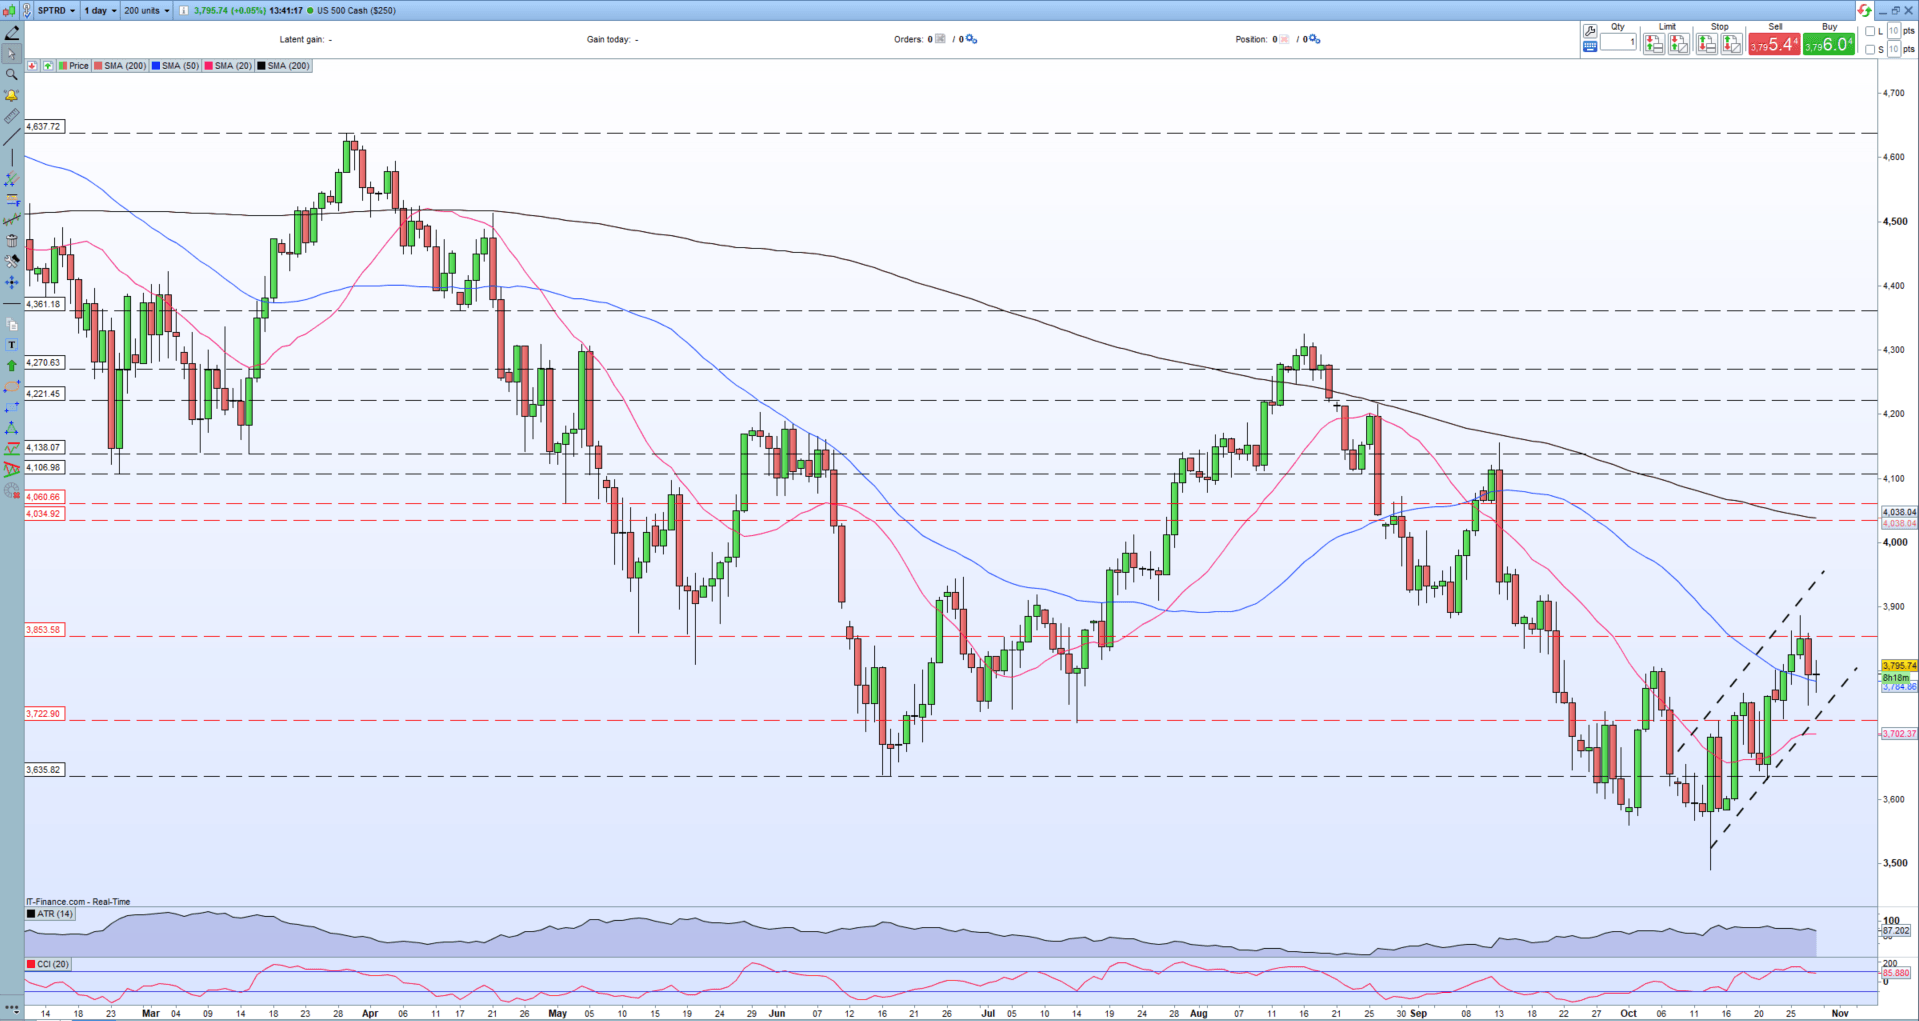
The S&P 500 is also showing a bearish flag formation but has broken above a prior lower high alleviating some bearish technical pressure. The S&P 500 is also above both the 20- and 50-day simple moving averages, again giving the technical outlook a little bit of a positive hue.
S&P 500 – Daily Chart
Retail trader data shows 56.24% of traders are net-long with the ratio of traders long to short at 1.29 to 1. The number of traders net-long is 4.52% higher than yesterday and 17.49% lower from last week, while the number of traders net-short is 8.87% lower than yesterday and 14.08% higher from last week.
We typically take a contrarian view to crowd sentiment, and the fact traders are net-long suggests US 500 prices may continue to fall. Positioning is more net-long than yesterday but less net-long from last week. The combination of current sentiment and recent changes gives us a further mixed US 500 trading bias.
| Change in | Longs | Shorts | OI |
| Daily | 1% | -4% | -2% |
| Weekly | -2% | -8% | -5% |
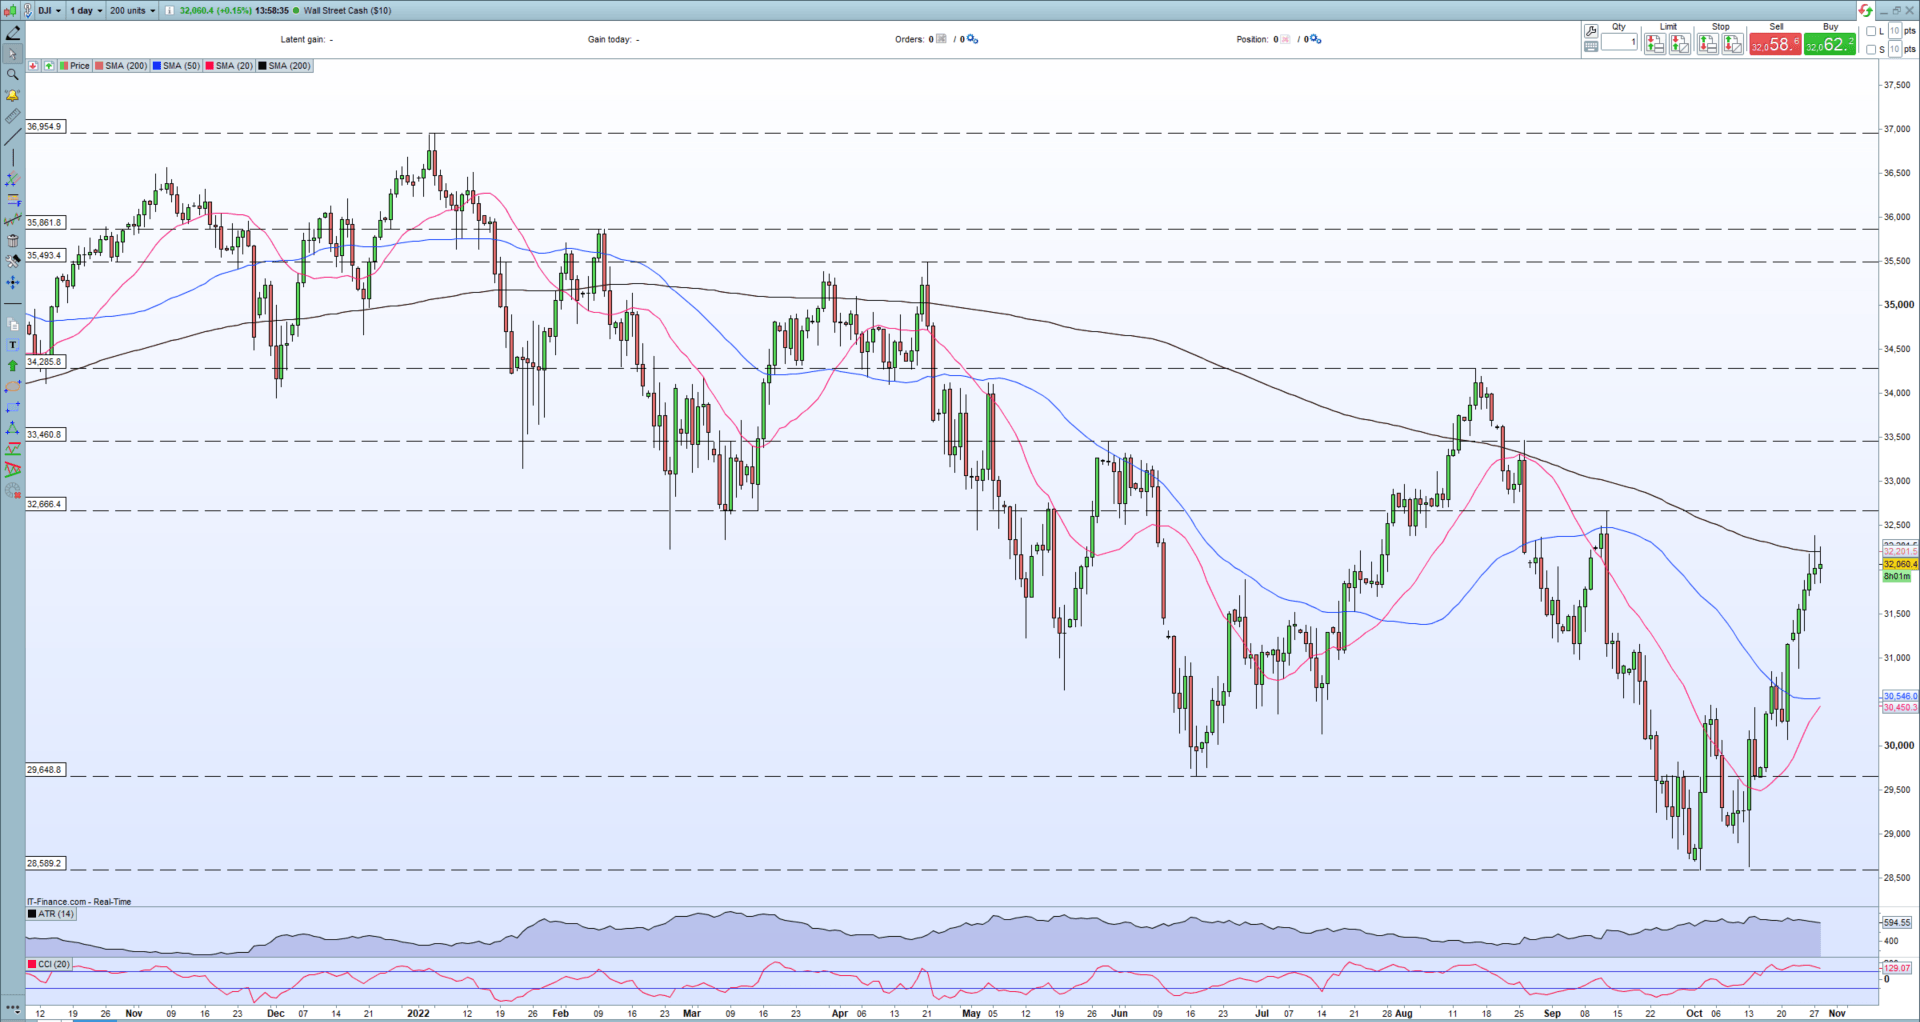
The Dow Jones daily chart is looking the most positive of the three indices with an unbroken run of positive candles this week so far and a confirmed double-bottom. The Dow is also a way above the 20- and 50-day smas and is currently touching the 200-day sma. A confirmed break above here would suggest further gains for the Dow Jones.
Moving Averages – A Complete Guide
Double Bottom Pattern: A Trader’s Guide
Dow Jones – Daily Chart
For all market-moving data releases and economic events see the real-time DailyFX Calendar.
Foundational Trading Knowledge
Understanding the Stock Market
Recommended by Nick Cawley
What is your view on US Indices – bullish or bearish?? You can let us know via the form at the end of this piece or you can contact the author via Twitter @nickcawley1.


